The latest workplace statistics reveal that the coronavirus pandemic has impacted the workplace significantly. Companies have been trying to create a working environment where employees will thrive again.
Apart from that, the diverse multi-generational workforce has driven companies to rethink their culture. From the way they look to the way they operate, organizations have had to make various changes to create an engaging environment that not only draws in top talent but also encourages innovation.
Read on and learn how to keep employees engaged in this ever-evolving world.
10 Top Workplace Trends, Stats, and Facts: Editor’s Choice
- 58% of employees in the riskiest jobs are women.
- One in three labor force participants in the US is a millennial.
- Women will account for 51.9% of the US labor force by 2060.
- Only 33% of the US and Canadian employees feel engaged at work.
- Companies in the top quartile of engagement see 23% higher profitability.
- The average productivity growth rate in the US is 1.4% per year.
- 42% of employers in pet-friendly workplaces say pets increase the staff’s productivity.
- Anxiety and depression cost the global economy $1 trillion each year.
Workplace Statistics for 2022
1. 66% of leaders consider redesigning office spaces for hybrid work.
(Statista)
As one of Statista’s surveys points out, 73% of people want a flexible working schedule even after the pandemic ends. Many people have seen the benefits of remote work, so companies will have to adjust to keep most of their employees engaged and satisfied.
2. 72% of employees report their companies will permanently allow some amount of remote work.
(Buffer)
The last two years have brought many changes for almost every organization. That’s why many companies are shifting to remote work. According to Buffer’s 2022 workplace statistics, 72% of workers said their employees plan to keep the option for some amount of work, compared to only 46% who said the same in 2021.
3. 58% of employees in the riskiest jobs are women.
(Lorman)
Gender discrimination is present even in 2022. Workplace discrimination statistics show that almost 60% of workers in the most at-risk job positions are women. Furthermore, women are more likely to lose jobs due to automation and have got fired more frequently during the coronavirus outbreak.
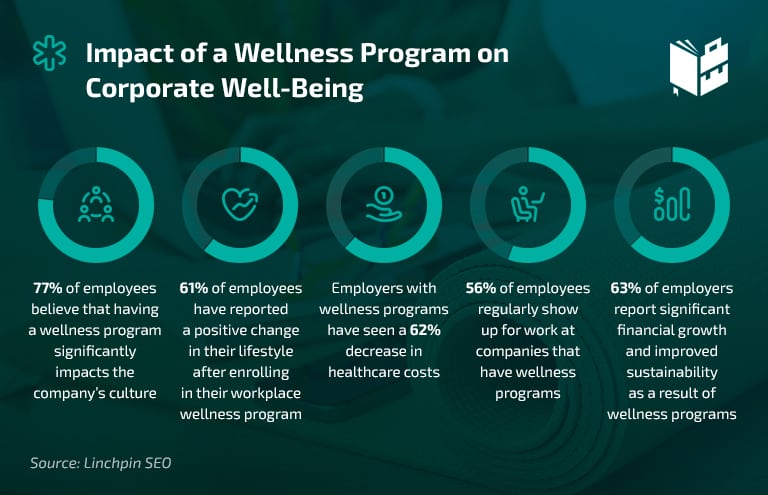
4. 77% of workers think that having a wellness program impacts a company’s culture.
(Linchpin SEO)
Workplace wellness is one of the most important things in 2022, as it’s beneficial both for workers and employers. Employers with wellness programs have seen a 62% decrease in healthcare costs, and 61% of employees have reported a positive change in their lifestyle after enrolling in their workplace wellness program.
Millennials in the Workplace Statistics
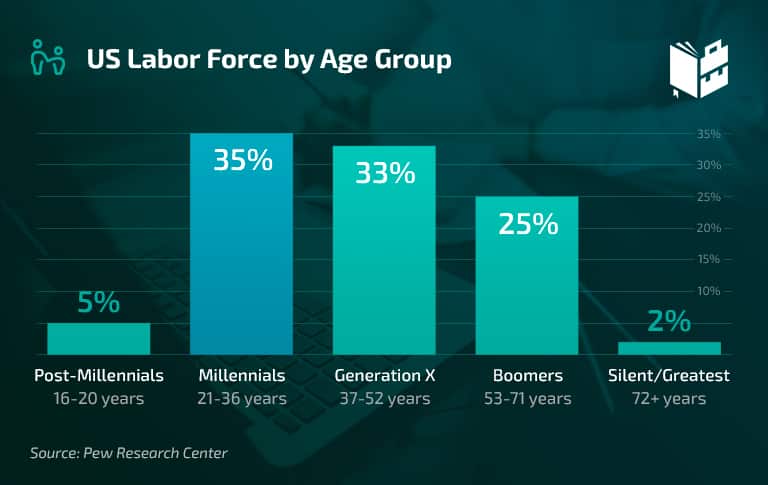
5. One in three labor force participants in the US is a millennial.
(Forbes)
There are 56 million employed millennials currently, comprising over 33% of the US workforce. Generation Z is in second place with 53 million workers, followed by baby boomers (41 million). However, the percentage of millennials in the workforce has yet to reach its peak since it is expected to rise in the next few years.
6. 56% of millennial working women feel isolated.
(HrNxt)
Millennials value emotional well-being. However, women value emotional stability more than men, as only 44% of millennial men feel lonely and isolated. Apart from that, workplace stress statistics indicate that millennials are the most stressed-out generation: over 70% of all millennials in the workforce experience high or very high stress levels.
Building a culture of inclusion enables the workforce to express their authentic selves at work. Organizations must also strive to provide opportunities for workers to get to know each other, build trust, and make friends.
7. 24% of millennials have been employed at five or more organizations.
(O.C. Tanner)
Millennial statistics from a survey of 10,000 workers from 12 countries across the world, O.C. Tanner discovered that nearly a quarter of millennials have worked in at least five organizations. Meanwhile, 60% of millennials have worked at two to four organizations.
Millennials are always on the move, hopping from one company to the next until they find one that they can connect with. Unfortunately, being on a constant job hunt has negative implications on a person’s career aspirations.
8. 92% of millennials value recognition and appreciation.
(Akumina)
Millennials in the workplace statistics show that most millennials quit their jobs because they find them toxic. Many switch jobs because they don’t trust their managers or feel underappreciated. Studies suggest that 92% of millennials find it important to be recognized and appreciated by their colleagues for their hard work.
Constant job hunting has negative implications on a person’s career outlook. It’s a vicious cycle that can be broken by companies by embracing a modern workplace where all employees thrive.
Women in the Workplace Statistics
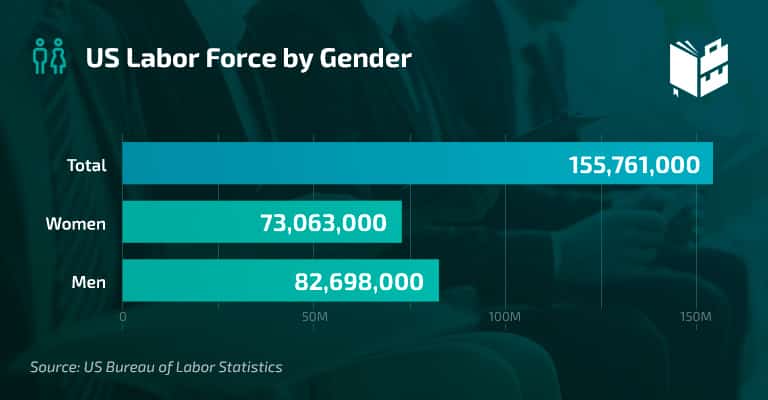
9. 56.1% of US women were in the labor force in 2021.
(US Bureau of Labor Statistics)
The US civilian labor force currently consists of 161 million people. Factors such as population growth, immigration, and workforce participation rates are expected to affect the growth of the nation’s labor force. There were 75,699,000 women in the workforce in 2021, while there were 85,505,000 men.
10. Women’s labor force participation is estimated to reach 51.9% in 2060.
(US Bureau of Labor Statistics)
The Bureau of Labor Statistics survey involved individuals aged 16 or more from around 60,000 households. Currently, more than half of the entire US workforce consists of women. However, women’s participation rate in the workforce has been gradually declining over the years since it peaked in 1999 at 60%.
11. For every 100 men promoted to senior management, only 79 women receive the same promotion.
(Gulf Business)
The latest women in leadership statistics show that there’s a lack of female representation in senior management positions, especially for women of color. For every 100 men that get promoted to a managerial role, only 79 women receive a similar promotion. Furthermore, the coronavirus pandemic has had a very negative impact on working women.
Given the history of women in the workplace, the world has made significant strides over the years. At this pace, though, it will take another decade for women to be promoted to managerial roles at equal rates as their male counterparts.
12. Women occupy 32 CEO positions at S&P 500 companies.
(Catalyst)
The majority of S&P 500 board seats have always been held by men. More recent data on women in the workforce, particularly in S&P 500 companies, show that there has been steady improvement over the years. However, there are currently only 32 female CEOs, which is a meager 6.4%.
13. The median salary for women is around 18% lower than the median salary for men.
(PayScale)
The average salary of a woman is 18% less than what their male counterparts earn. The discrimination and diversity in the workplace statistics from PayScale show that wage inequality in the workplace is a problem that occurs across all industries.
Data shows that women only make $0.82 for every dollar that men make. Since 2015, the pay gap has barely shrunk. In addition, even for jobs where women and men are required to have the same qualification, female workers are still paid less.
14. American Indian and Alaska Native women earn $0.71 for every white man’s dollar.
(PayScale)
Female employees are still underpaid, especially black and Native American women. PayScale’s women in the workplace statistics revealed that women of different ethnicities face varying degrees of discrimination when it comes to fair compensation.
Since PayScale only studied respondents with a bachelor’s degree, the pay gap may seem smaller compared to other reports such as the “Current Population Survey.”
15. Female doctors and surgeons make $43,000 less than men in the same fields.
(Politico)
Aside from race, gender inequality in the workplace statistics show that discrimination persists across different sectors of employment.
According to Joblist’s new analysis of median salary for 123 professions, male doctors and surgeons earn significantly more than women. It should be taken into consideration that this is not one of the jobs where “women make choices that lower their salary.”
Employee Engagement and Satisfaction Statistics
16. Happy employees are five times more likely to stay.
(Qualtrics)
Unhappy employees statistics show that managers have a lot to do with employee engagement and retention. Acknowledging and appreciating employees for their hard work goes a long way since happy employees are five times more likely to stay with their company.
17. Only 33% of the US and Canadian workforce feels engaged at work.
(Gallup)
Gallup’s latest global workplace statistics revealed that 67% of the labor force doesn’t feel actively engaged. The situation in the rest of the world is even more worrying, as only 21% report being engaged.
Nurturing camaraderie and friendship in the workplace can keep employees happy and engaged. So, companies should provide opportunities for their people to get together after work hours to improve communication and interactions.
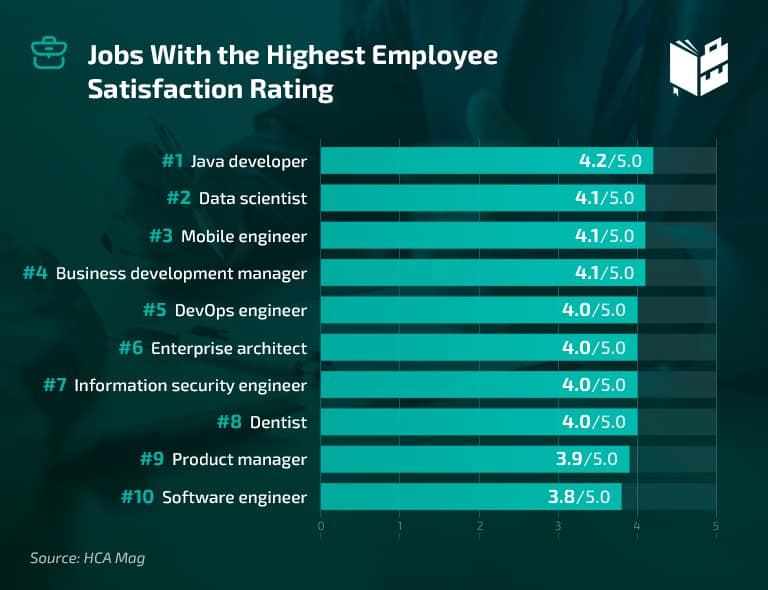
18. Java developer is the job with the highest satisfaction rate (4.2 out of 5).
(HCA Mag)
Job satisfaction varies across industries. According to happiness and productivity at work statistics, the job with the highest number of satisfied workers in 2021 was Java developer. The satisfaction is rated 4.2 out of 5. The states with the most demand for this position are California and Virginia.
19. 56% of older workers believe fun in the workplace is important.
(People Development Magazine)
According to some fun in the workplace statistics, 79% of younger workers think fun at work is essential, compared to only 56% of older employees. Namely, 44% of recent graduates who have just started working think that fun in the workplace increases work ethic, while only 14% of older workers do.
20. Companies in the top quartile of engagement see 23% higher profitability.
(Gallup)
Workplace engagement and productivity go hand in hand. Compared to organizations in the lower quartile, the top quartile sees a 23% earnings-per-share growth. Organizations at the top quartiles also tend to have higher productivity levels in sales (18%) and production (14%), higher customer loyalty (10%), and lower turnover for both low-turnover (43%) and high-turnover companies (18%).
Workplace Productivity Statistics
21. US nonfarm business productivity decreased 4.1% in the second quarter of 2022.
(US Bureau of Labor Statistics)
Output in the nonfarm sector also experienced a decrease (1.4%), while hours worked increased by 2.7%. Additionally, productivity declined by 2.4% from the same quarter last year, marking the largest decrease since Q1 1948, when the first report was released.
Workplace statistics also reveal that labor costs increased by 10.2%, reflecting the 4.1% decrease in productivity and a 5.7% rise in hourly compensation.
22. The average productivity growth rate in the US is 1.4% per year.
(CNBC)
On average, productivity has increased by 1.3% since 2007, which is not even half of the rate of productivity from 2000 to 2007 (2.7%). Since then, the average productivity growth rate has slowed to 1.4% per year. Throughout 2019, the rate rose to 1.9%, which was promising. However, average employee productivity statistics suggest the pandemic decreased the numbers significantly.
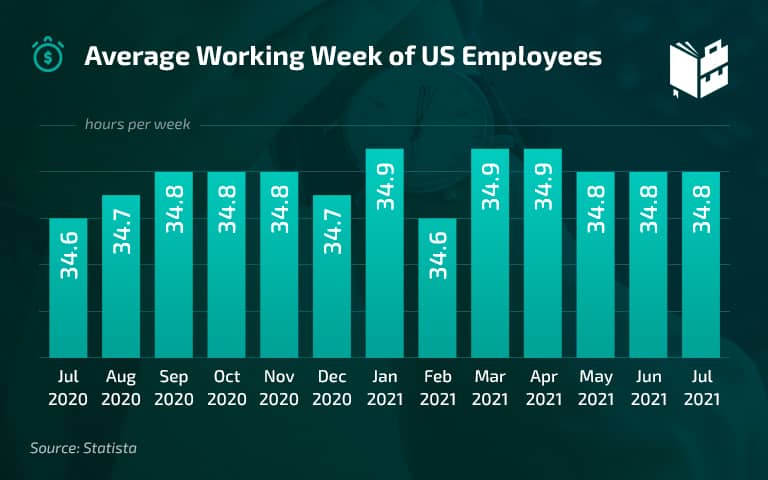
23. Americans spend an average of 34.5 hours at work per week.
(Statista)
The number of working hours per week has only slightly decreased from August last year for all employees on private nonfarm payrolls in the US. The latest workplace productivity statistics show the average working hours in the US workforce vary across industries.
The US workforce works about 3.9 billion hours in one month. However, the average work week for an employee in the mining and logging industry is 46.4 hours long. Employees in education and health work 33.3 hours per week on average.
24. America’s health problems, vices, and distractions cost employers a $1.8 trillion loss in productivity annually.
(HubSpot)
The financial repercussions of a poor workplace culture can be monstrous. America’s vices, distractions, and health problems cost US employers $1.8 trillion, according to workplace wellness statistics. From hangovers to endless social media scrolling, unideal habits cost US employers a lot of money.
The current data suggests that there’s a need for companies to start investing more in building an ideal workplace that stimulates their employees. A time tracking tool implementation and reliable employee management solutions are good starting points.
25. Employees who work in collaborative settings are 50% more productive than those who work individually.
(Zippia)
Workplace collaboration statistics suggest that organizations that promote collaboration have better-performing employees. Those who work with others are also 64% more likely to stick to the task at hand. Overall, the top performers spend 45% of their work time collaborating with other workers, 45% on individual tasks, and 10% on socializing and learning.
26. 33% of employees say environmental factors negatively affect their productivity and engagement levels.
(View)
Workplace wellness trends emphasize the effect of environmental factors on employees’ welfare. Studies have shown that employees lose an hour’s worth of productivity due to environmental factors.
A View survey found that one in four employees says good air quality enables them to exert their optimal effort at work. What’s more, nearly 40% of workers prefer natural light, while nearly half want their companies to set the right temperature in the workplace.
27. Organizations with gender-diverse executive teams outperform less gender-diverse organizations by 25%.
(McKinsey & Company)
Workplace diversity statistics show a correlation between diversity and financial performance. McKinsey & Company found that companies in the top quartile for gender diversity on executive teams are 25% more likely to have above-average profitability than those with less gender diversity.
Similarly, the same report shows that ethnically diverse organizations are 36% more likely to enjoy profitability higher than the national average.
28. 42% of employers in pet-friendly workplaces say pets increase the staff’s productivity.
(PR Newswire)
Embracing a pet-friendly culture is one of the most effective ways to boost productivity, as work environment productivity statistics indicate. Pets can significantly lower the stress levels of employees. In turn, they can help increase the productivity of the workforce.
Banfield Pet Hospital’s survey tells us that 48% of employers had a pet-friendly policy long before the pandemic. But 42% of them noticed increased productivity levels among employees during the pandemic. Moreover, 23% of the respondents claim they would be more productive with their pets by their side in the workplace.
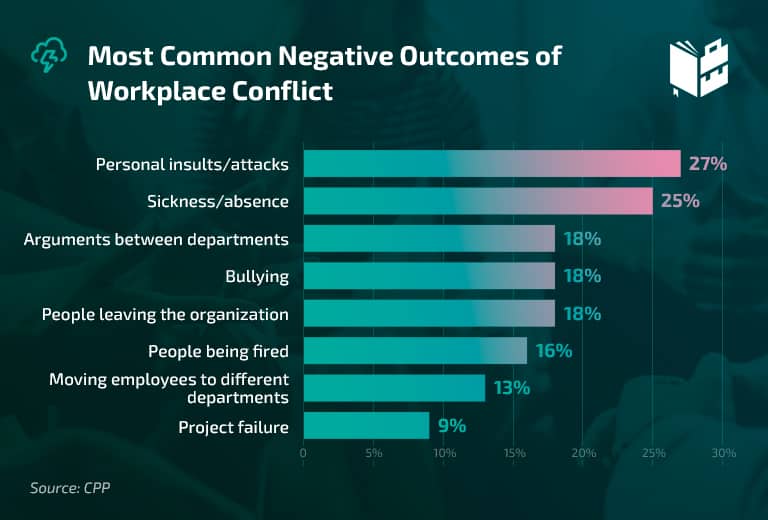
Workplace Conflict Statistics
29. There were 61,331 discrimination charges in the US in 2021.
(EEOC)
In 2021, a total of 61,331 discrimination charges were filed in the US. The figure accounts for individual charge filings. Since a person can file multiple charges, citing different kinds of discrimination, the total figure for an entire fiscal year will be less than the total number of the 10 types of workplace discrimination listed in EEOC’s data.
Research suggests that the cost of conflict in the workplace in 2021 amounted to $350.7 million in damages. The victims of discrimination belong to the private sector and state and local government workplaces.
30. Men filed 16.3% of sexual harassment in the workplace charges in 2021.
(EEOC)
The EEOC 2021 data reveals there were 5,581 receipts for charges alleging sexual harassment. The percentage of charges filed by men has remained stable for the last 12 years, ranging from 15.9% to 17.8%, according to sexual harassment in the workplace statistics.
31. 25% of remote work conflicts are caused by stress about work.
(MyPerfectResume)
In MyPerfectResume’s study on remote work conflict, the leading causes of conflict are stress about work and lack of teamwork, with a 25% share each. At 22%, rude behavior is the third leading contributor to work-related conflict.
The findings also indicate that the lack of transparency or honesty and a clash of values account for 18% and 9% of conflict among coworkers, respectively.
32. 58% of employees have quit work due to negative office politics.
(Randstad)
Two workplace fun facts employers should remember: a toxic office environment and poor company reputation can repel potential applicants or lead current employees to quit. Randstad USA discovered that 58% of employees leave their jobs because of office politics. What’s more, around 86% of workers won’t even consider applying for a company with negative reviews from employees. The same goes for companies with public conflicts with employees.
33. 91% of Fortune 500 companies have gender identity protections.
(HRC)
Gender discrimination continues to be a widespread problem in workplaces across America, based on workplace diversity statistics for 2022. But there has been some progress over the years. The Human Rights Campaign Foundation’s most recent CEI indicates that 91% of Fortune 500 companies have gender identity protections highlighted in their non-discrimination policies.
In addition, 97% of all CEI participants offer explicit gender identity non-discrimination protections. This number is up from 5% in 2002.
34. 51% of employees aged over 40 say their age would prevent them from getting a job.
(Senior Living)
Senior Living surveyed 1,239 employees aged 40 and over. It turns out that age discrimination is a serious issue in workplaces across the US. Workplace conflict statistics show that over half of employees aged over 40 say their age would be an obstacle to getting a new job, up by 10% from 2021.
Additionally, 9% of workers aged over 40 have experienced age-related discrimination in the workplace. Also, a third of them claim they don’t report it to their superiors since it often ends in only mild repercussions to the wrongdoer.
35. 43% of employees will quit their job if there’s too much competition.
(Robert Half, Niagara Institute)
Around 40% of employees find their workplace somewhat competitive, while 26% think it’s very competitive. Competition in the workplace, statistics suggest, isn’t always good for business, mainly because it could cause employees to leave. However, Niagara Institute reports that 87.8% of respondents would compromise in order to break a deadlock.
Companies often encourage competition to drive productivity and increase motivation. While some do thrive under pressure, research shows that a company with an overly competitive work environment can potentially kill motivation.
Workplace Injury Statistics
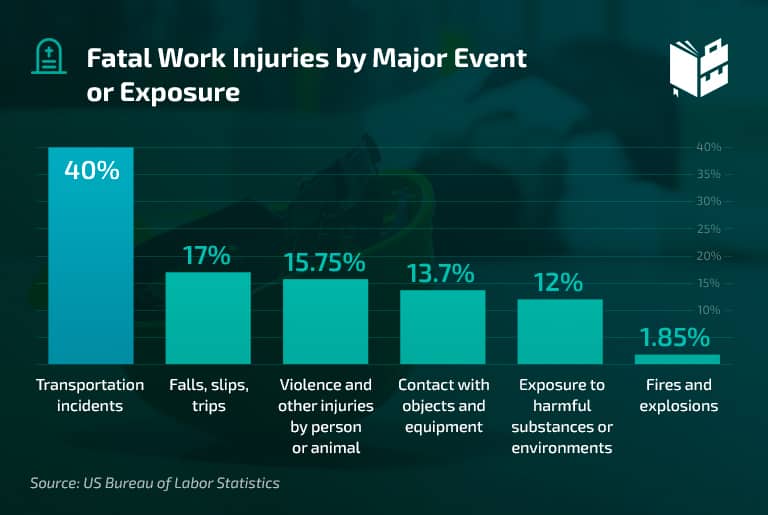
36. 37.3% of all workplace fatalities are caused by transportation accidents.
(US Bureau of Labor Statistics)
The private industry experienced 4,349 fatalities on the job in 2020, down by 558 cases from 2019. Vehicle accidents are the leading cause of death by type of event. To be exact, 1,778 (37.3%) of all workplace fatalities were caused by transportation accidents.Workplace death statistics showed a decrease in falls, slips, and trips. Still, these incidents were the second most common reason for fatalities, with 805 reported incidents. Additionally, the number of suicides experienced a significant drop from 307 in 2019 to 259 in 2020.
37. Injuries and illnesses in the workplace are down from 2.8 to 2.7 incidents per 100 employees.
(US Bureau of Labor Statistics)
Non-fatal workplace injuries and illnesses have decreased drastically over the years. Still, there’s so much room for improvement. Companies can do better to provide safer work environments for their people.
According to the most recent workplace injury statistics, the injuries and illnesses count decreased by only 5.7% between 2019 and 2020. However, while there were fewer injuries in 2020, the number of reported illnesses more than quadrupled to 544,600 as a direct consequence of the COVID-19 pandemic.
38. Texas accounts for 3.9% of workplace deaths.
(TDI)
Texas saw a 23% decrease in workplace fatalities in the US in 2020. Largely due to transportation incidents, falls, and contact with objects and equipment, the most recent workplace injury statistics by state show Texas suffered 469 occupational deaths in 2020 (down from 608 in 2019).
Additionally, the majority of the workplace deaths in Texas are men (93%), and a third of all fatalities were people aged 55 or more.
39. At 1,228, transportation and material moving is the industry with the highest fatality count by occupation.
(US Bureau of Labor Statistics)
Recent construction injury statistics show that transportation (1,228 cases) and construction occupations (976 cases) comprised 47.4% of all workplace fatalities in 2020. Fatal injuries in healthcare rose by 15.8%, while those in law enforcement had an 18.6% increase.
40. Work-related fatalities are down from 38 deaths per day to 15 in over four decades.
(OSHA)
There has been approximately a 60.5% decrease in fatalities per day in the last decades. From an average of 38 deaths per day in the 1970s, the number has decreased to 15. The number of injuries and illnesses has also dropped from 10.9 to 2.8 incidents per 100 employees during the same period.
Workplace Stress Statistics
41. 65% of employees claim their stress levels have skyrocketed over five years.
(Korn Ferry)
From horrible bosses to changes in organizational leadership, Korn Ferry’s recent survey highlighted some of the biggest stress triggers in the office. Others include increased workloads, unresolved conflict, and ever-evolving technology. At the same time, the survey revealed that 79% of the employees find not having enough work is more stressful than having too much to do.
It seems like employees feel they aren’t compensated well enough, given that work-related stress levels are still on the rise. According to statistics on the main causes of workplace stress, 35% of employees claim their boss is their main stressor.
42. 44% of employees in the US suffer from high work-related stress daily.
(Gallup)
Gallup’s State of the Global Workforce report states that American workers experience work-related stress levels far above the global average (44%) on a daily basis. East Asia (55%), Latin America (50%), and the US and Canada (50%) were the most stressed regions.
This workplace stress survey also found that working women and people under 40 have experienced higher stress levels, especially women in Latin America (60%) and the US and Canada (54%).
43. Anxiety and depression cost the global economy $1 trillion each year.
(WHO)
Poor stress management costs the global economy $1 trillion in lost productivity, according to World Health Organization stress statistics. For every dollar US employers invest in mental health treatments, they receive a return of $4 in improved productivity.
The World Health Organization has established guidelines that can help organizations promote mental health in the workplace. They show human resources how to manage acute stress, anxiety, and PTSD and also cover other effects of work-related stress or burnout.
44. 16% of employees quit because of stress.
(Korn Ferry)
There is a wealth of workplace stress articles that can tell you how stress has long-term effects on health. In a recent study, Korn Ferry found that 76% of workers said stress has negatively impacted their personal relationships, while 16% have lost sleep because of it. What’s more, the study showed that 16% of employees have had to leave their jobs due to overwhelming stress levels.
45. 82% of employees are burned out.
(O.C. Tanner)
According to O.C. Tanner, employee burnout is a new workplace-related crisis. Workplace safety statistics reveal that four out of five employees are suffering from mild, moderate, and severe burnout.
Chronic stress can lead to poor employee retention and high turnover rates. Organizations, therefore, need to measure workplace burnout properly and actively seek ways to mitigate it.
46. Companies that value employees’ social, physical, and mental health can reduce workplace stress by 52%.
(O.C. Tanner)
Nurturing a positive work culture in the modern workplace entails showing empathy towards employees, fostering social connections, and making room for a little fun. O.C. Tanner’s workplace stress statistics suggest employees are 52% less likely to feel stressed when the company takes care of their emotional and social well-being.
47. Leveraging natural light can decrease incidences of eyestrain by 51%, headaches by 63%, and drowsiness by 56%.
(Cornell University)
There are many ways to promote health and well-being in the office. Incorporating stress-reducing elements into workplace design, for instance, has proven to be an effective way to reduce employees’ stress levels.
Research has shown that one of the main causes of workplace stress is poor lighting. By letting natural light in the workplace, employers can significantly decrease stress indicators such as eye strain by 51%, headaches by 63%, and drowsiness by 56%.
48. 80.6% of employees feel more comfortable in buildings with electrochromic glass.
(Cornell University)
In the study, researchers tested the effects of daylight and other visual elements on job satisfaction, health, and productivity. They found that electrochromic glass improves the quality of indoor light. As a result, it increases the comfort and wellness levels of employees.
Workplace Statistics — The Takeaway
The modern workplace is mired in change, driven by the ever-changing nature of work, technology, and society. Organizations must maintain optimal arrangements in the workplace to keep up with the demands of their employees.
In doing so, companies can reduce stress, improve engagement, reduce turnover, and boost productivity. Businesses that go the extra mile to cater to the needs of their workforce will reap the best rewards, as the stats above show.
Cultivating a good brand culture, promoting a healthy work-life balance, creating growth opportunities, and honing excellent leaders are all potential solutions that help improve retention and productivity.