Women in the workplace statistics show that the position of female workers has significantly improved as women have been conquering male-dominated roles across industries. Furthermore, female employees across the globe have achieved higher levels of equality.
Despite the overall progress, women still have many problems at work. For example, their salary is still lower than their male coworkers’ in the same jobs. Also, women frequently face gender and racial discrimination in the workplace.
To understand better what happens to working women, have a look at the data below.
Top Statistics on Women in the Workforce — Editor’s Choice
- There are 74 women CEOs at Fortune 500 companies.
- Women comprise 26% of employees in the computing workforce.
- The most common job for women is a preschool and kindergarten teacher.
- 56.1% of women in the US participate in the job market.
- Around 152,000 women joined the US labor force in August 2022.
- Women in Rwanda and Solomon Islands have the highest employment rate at 83%.
- 59% of women in the world deal with non-inclusive behavior at work.
- 21% of the women workforce in the UK is in the health and social work sector.
Women in Leadership Statistics
1. The number of women CEOs at Fortune 500 companies is 74.
(Statista)
In other words, only 15% of the Fortune 500 chief executives are women. Still, this is a groundbreaking year for women in leadership. There were only seven female CEOs on the list 20 years ago.
2. Only 24 countries have women as the Head of State or Government.
(UN Women)
According to women in leadership roles statistics, 10 countries have a female Head of State. Moreover, only 13 countries have a female Head of Government. According to estimates, these positions won’t reach gender equality for at least 130 years at the current rate.
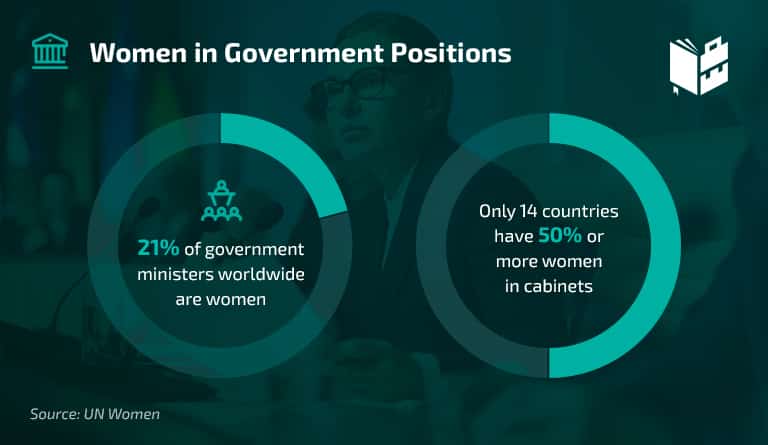
3. 21% of government ministers are women.
(UN Women)
Recent research shows gender equality in ministerial government positions won’t happen for another 55 years. The same goes for the lower positions, as women see a 0.52% annual increase in ministerial positions. Yet, only 14 countries have 50% or more women in cabinets.
4. Male vs. female employment statistics suggest that 18% of board chairs belong to women in Australia.
(WGEA)
There aren’t many women in executive or decision-making roles in the Australian workforce. In fact, roughly 32.5% of key management positions belong to women. Moreover, they comprise 33% of the total number of board members. On the other hand, only 19.4% of women are CEOs across industries in this country.
5. Women hold 32% of senior management positions in the world.
(Grant Thorton)
According to an international survey, the proportion of women in senior management has been slightly increasing for the last couple of years. Statistics on women in the workplace also tell us that the proportion of women in senior management hasn’t changed from 2021 (90%).
6. 40% of senior managers in Africa are female.
(Grant Thorton)
The most recent international survey data ranks Africa as the region with the largest number of female executives. The situation for women in Africa has improved drastically thanks to the reforms promoting gender equality in the workplace and domestic settings. Conversely, Asia-Pacific has 29% of women in senior management.
7. Female entrepreneurship statistics for 2022 say 10.7% of women business owners are millennials.
(Guidant Financial)
When asked why they had become business owners, 57.9% of the women answered they had been ready to be their own boss. Moreover, approximately 22.4% of America’s business owners are women. In fact, most of them are from Gen X — 68.9%. Female baby boomers are second with 19.4%, and millennials are third with 10.7%.
Working Women Statistics by Occupation
8. 74.3% of all healthcare practitioners and technical occupations are women.
(BLS)
The latest available report says the most common occupations for women in healthcare are speech-language pathologists and dental hygienists (95.1% each). Moreover, women account for 91.3% of licensed practical and licensed vocational nurses.
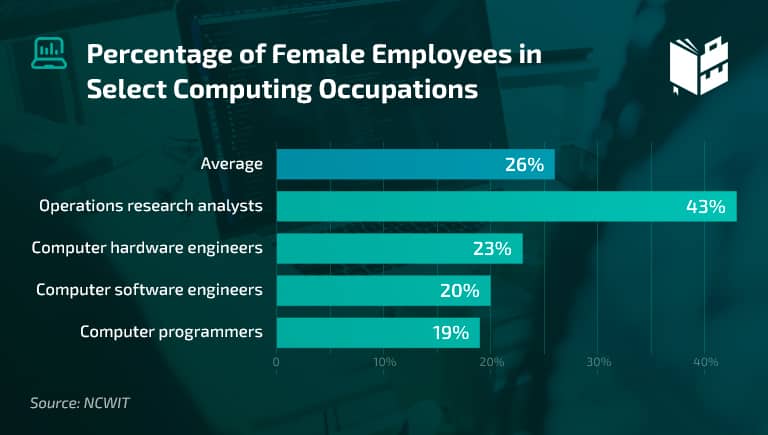
9. Women make up 26% of employees in the computing workforce.
(NCWIT)
Women typically have execution rather than core technical roles in computing. For example, the highest percentage of women in the workplace is among operations research analysts (43%). Furthermore, 19% of women work as computer software engineers, and 20% work as computer programmers.
10. Women hold 23.8% of protective service occupations.
(BLS)
Approximately a quarter of 2,987 workers in the protective service are women. In addition, about 42.3% of them work as private detectives and investigators. What’s more, female first-line supervisors of security workers make up 21.5% of the total number of workers in the protective service.
11. The most common job for women is a preschool and kindergarten teacher.
(Stacker)
Women employment statistics say 97.3% of all preschool and kindergarten teachers are women. Traditionally, education is one of the occupations with an extremely high percentage of female employees.
12. 16% of female lawyers lose work opportunities as a result of rejecting sexual advances.
(Statista, Antitrust Institute)
Women make up 37.9% of US lawyers. However, a significant share of women in the law sector don’t get the job because they decline sexual advances. Moreover, 50% of women in law firms have experienced unwanted sexual conduct in the workplace. Despite that, more than a quarter of them (28%) haven’t reported it due to the fear of retaliation.
General Statistics on Women in the Workforce
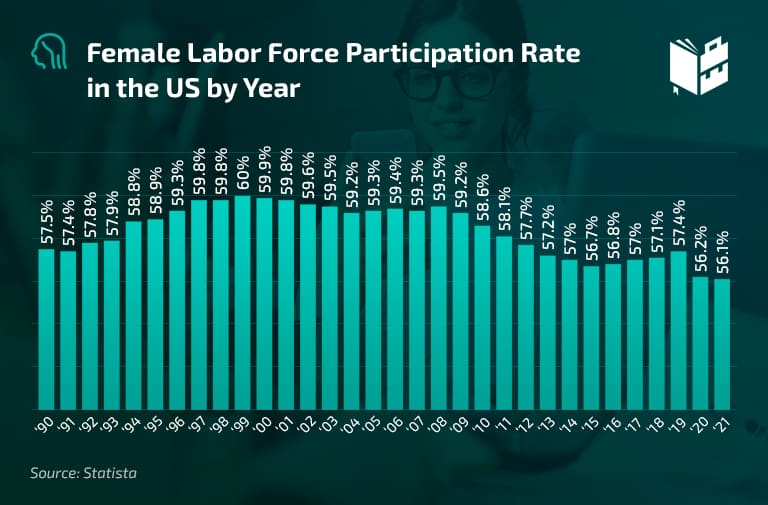
13. 56.1% of women in the US participate in the job market.
(Statista)
Historically, the workforce participation rate of women in the US has fluctuated. During the last 30 years, it reached the highest level in 1999 with a 60% workforce participation rate. However, the numbers have decreased since then.
14. The workforce participation rate for women with school-aged children is 72.4%.
(Gallup)
The data relates to adults aged 25 to 55. Furthermore, the percentage of women in the workforce in this specific group declined by 2.3%, as it used to be 74.7% in February 2020.
15. Around 152,000 women joined the workforce in August 2022.
(BLS)
The most recent Bureau of Labor Statistics job report shows that 3.3% of women don’t have a job or aren’t looking for one. The data includes women from different demographic groups. For example, about 5.9% of Black women and 4.3% of Latinas don’t participate in the workforce. Moreover, 3.1% of Asian women are unemployed.
16. The median weekly earnings for female full-time wage and salary workers in Q2 2022 are $943.
(BLS)
Women in the workplace statistics show that women earn 82.4% of the median for men ($1,144). Female full-time workers in management, business, and financial operations occupations have the highest median weekly earnings ($1,265).
On the other hand, women employed in service occupations have the lowest median weekly earnings — $656.
17. 33% of women don’t want to return to their physical workplace.
(Forbes)
Women in the workplace facts gained from an extensive survey emphasize how beneficial remote work is for a third of the respondents. One of the reasons is that these women are more productive when working from home. In addition, they prefer the flexibility of remote work to 40 hours per week in the office.
18. 30% of women worry about losing their jobs to technology.
(Randstad)
Less than a third of the surveyed women are concerned about being replaced by automation in the workplace. Instead, jobs lost to automation statistics reveal women employed in IT, retail, customer service, and manufacturing express the most concern.
Stats and Facts About Women in the Workplace Worldwide
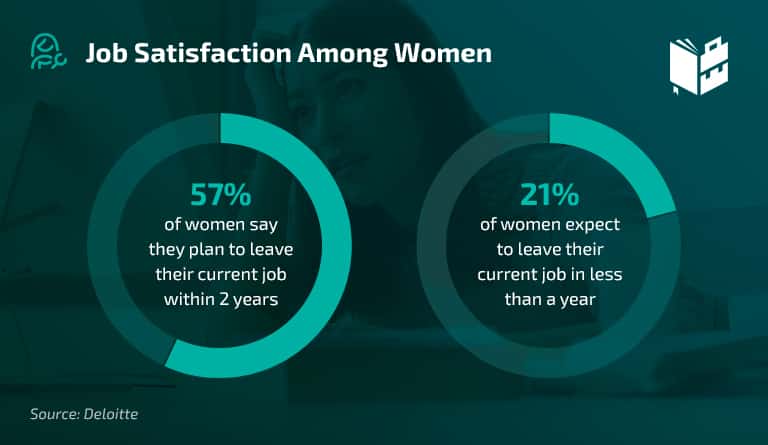
19. More than half of women plan to leave their current job within two years.
(Deloitte)
The majority of the surveyed women aren’t satisfied with their job, particularly those who work in non-managerial (59%) and middle management positions (64%). Burnout is the top reason they want to change their job.
20. Rwanda and Solomon Islands have the highest employment rate for women.
(The World Bank)
The latest data shows that 83% of women older than 15 in Rwanda and Solomon Islands are employed. This marks the highest percentage of females in the workforce by population worldwide.
21. Women comprise 47.9% of the entire workforce in Australia.
(WGEA)
Around 26.3% of these women work full time, and 21.6% of them are part-time employees. Additionally, 38.4% of full-time workers in Australia are women. Female employees also comprise 68.5% of all part-time workers in this country.
22. 59% of women in the world deal with non-inclusive behavior at work.
(Deloitte)
Gender discrimination in the workplace statistics from an international survey shows that almost three in five women experience harassment or microaggression in the workplace worldwide.
Disparaging remarks about their gender, unwanted physical contact, and undesirable comments about their physical appearance, gender, race, sexual orientation or gender identity, and similar, are examples of the non-inclusive workplace-related behavior respondents face daily.
23. 5% of women say they work for gender equality leaders, up by 1% from 2021.
(Deloitte)
According to the recent international discrimination against women in the workplace statistics, women are more productive and engaged in organizations with inclusive, flexible cultures.
These women are also more likely to report non-inclusive behavior without the fear of losing their job. Moreover, they are loyal to their employer because of the support they receive from the management.
24. 21% of all the female workforce in the UK is in the health and social work sector.
(Briefing Paper)
These two sectors have the most female workers in the UK. The wholesale and retail trade sectors are second, with 13% of the entire female labor force. Finally, in third place is education with 12%.
25. A female labor force participation rate by country shows women in India comprise 33% of all workers.
(The Wire, Statista)
Women’s labor force participation rate in India has decreased by 3% since last year. However, according to a survey involving 250 Indian companies, the percentage of women in Managing Director (MD) and Chief Executive Officer (CEO) positions increased to 55% this year.
26. The workplace participation rate for women in Canada is 60.6%.
(Statistics Canada)
Recent studies have shown that almost two-thirds of women over 15 in Canada take part in the job market. Moreover, the labor force participation rate is slightly higher than the year before, when it was 59.6%.
27. The total entrepreneurial activity rate for women is 11%.
(GEM)
Recent woman-owned business statistics show that the women’s TEA rate is over three-quarters of men’s (a 0.8% female-to-male ratio). Women entrepreneurs’ statistics also reveal that low-income countries have a 17.1% TEA rate for women, compared to an 8.9% rate in high-income countries.
Moreover, women in six countries (Angola, Indonesia, Kazakhstan, Oman, Saudi Arabia, and Togo) had equal or higher entrepreneurial activity than men.
Women in the Workplace Statistics — Conclusion
All this data suggests the women workforce has made huge steps forward. Women are now employed even in sectors in which we couldn’t have possibly imagined them a couple of decades ago. But although modern women in some positions are doing fine, they are struggling in others.
What’s more, the female labor force participation rate varies across the world. As we can see, a lot still needs to be done to make the female labor force equal and safe at work.