From the IDEA law’s enactment in 1975 to the Education for All Handicapped Children Act, the standards for special education vary to great extents among the states. These special education stats shed some light on how many students require special education, their problems, and how much support they receive from teachers and governments.
Special Education Statistics (The Highlights)
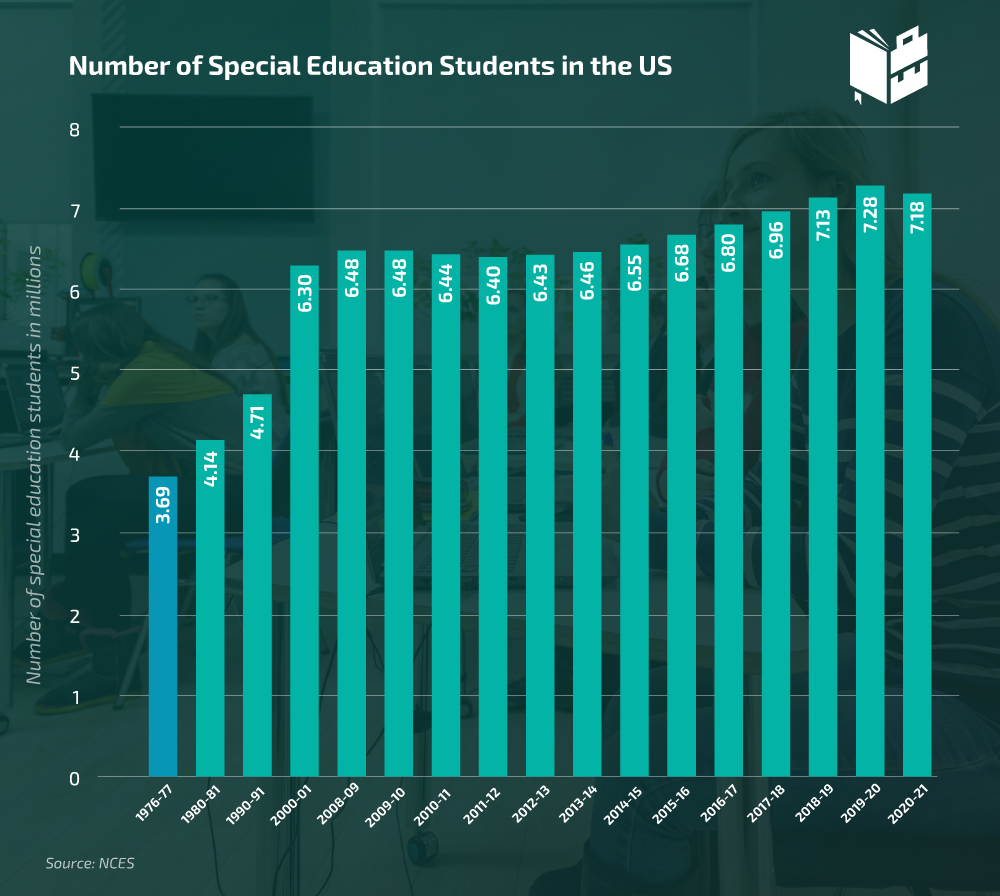
- There are 7.2 million special needs students in the United States
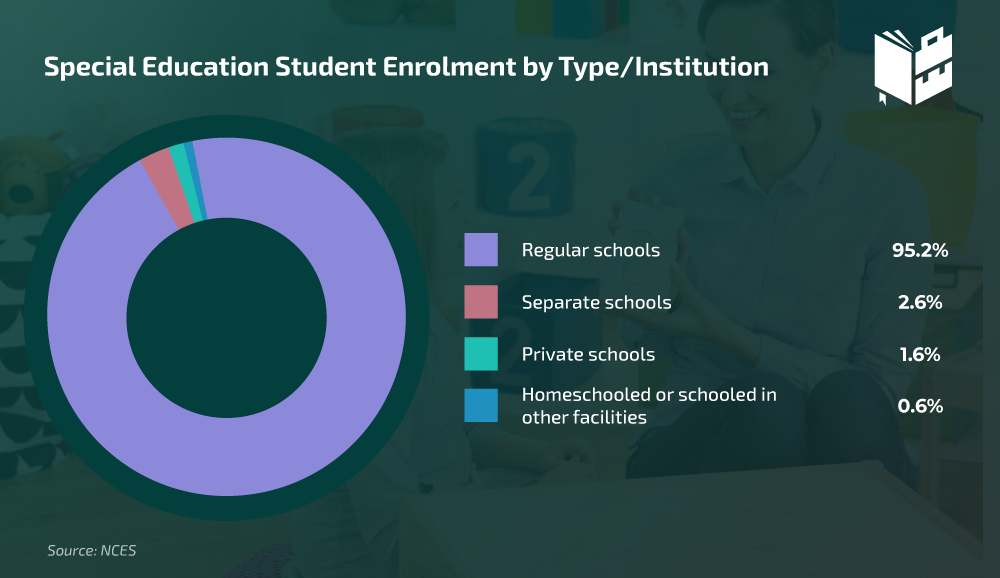
- 95.2% of school-age students served under IDEA are enrolled in regular schools.
- The most prevalent disability among students in the US is a specific learning disability.
- The US federal government allocated $17.1 billion for special education in 2022.
- The median annual salary for special education teachers is $61,820.
- At 20.5%, New York has the most significant percentage of students with disabilities enrolled in public schools.
- 19% of American Indian students are attending special education classes.
- 1 in 10 Australian students have a disability.
- 1.49 million UK students need special education.
- There are 1.2 thousand special needs education schools in Japan.
Facts About Special Education
How many special needs students are there in the US?
There are 7.2 million students aged 3-21 studying under the IDEA. This makes up 15% of all public school students across the US.
For comparison purposes, there were 6.5 million students with special needs in the 2009–2010 school year, accounting for 13% of all students in the US.
95.2% of school-age students served under IDEA are enrolled in regular schools.
In addition, 2.6% attend separate schools (private or public), and 1.6% of special ed students are enrolled in private schools. According to special ed statistics, fewer than 1% of students served under IDEA are homeschooled, schooled in hospitals, or in separate residential and correctional facilities.
Which disability Is the most prevalent among American schoolchildren?
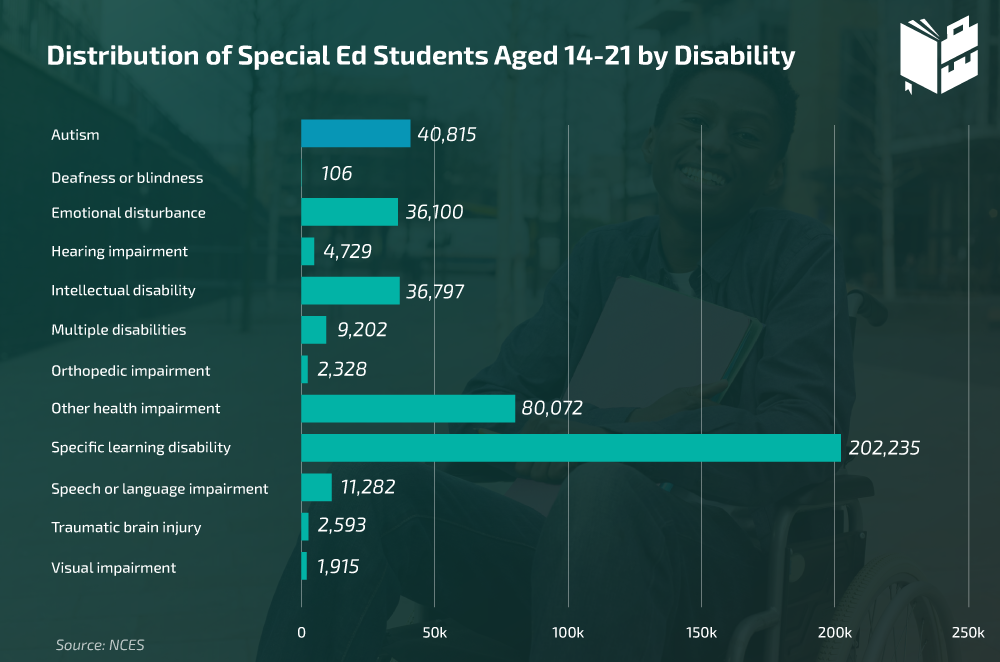
The most prevalent disability among students aged 3 to 21 in the US is a specific learning disability. This represents a disorder in one or more basic psychological processes involved in understanding or using spoken or written language.
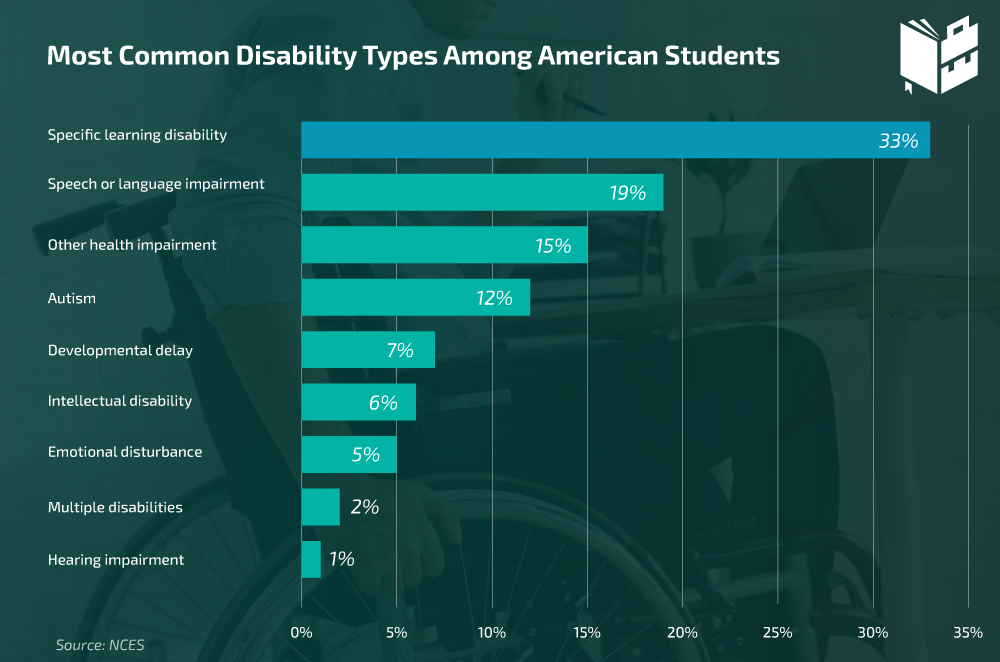
19% of special education students have a speech or language impairment.
15% of students have at least one other health impairment, while 12% of special ed students have autism.
The US federal government allocated $17.1 billion for special education in 2022.
This is approximately a $3.1 billion increase compared to the year before and roughly $3.8 billion more than it was spent in 2020.
The median annual salary for special education teachers is $61,820.
Special education facts reveal that the lowest-earning 10% earn less than $46,180 per annum, while the highest-earning 10% earn more than $100,040.
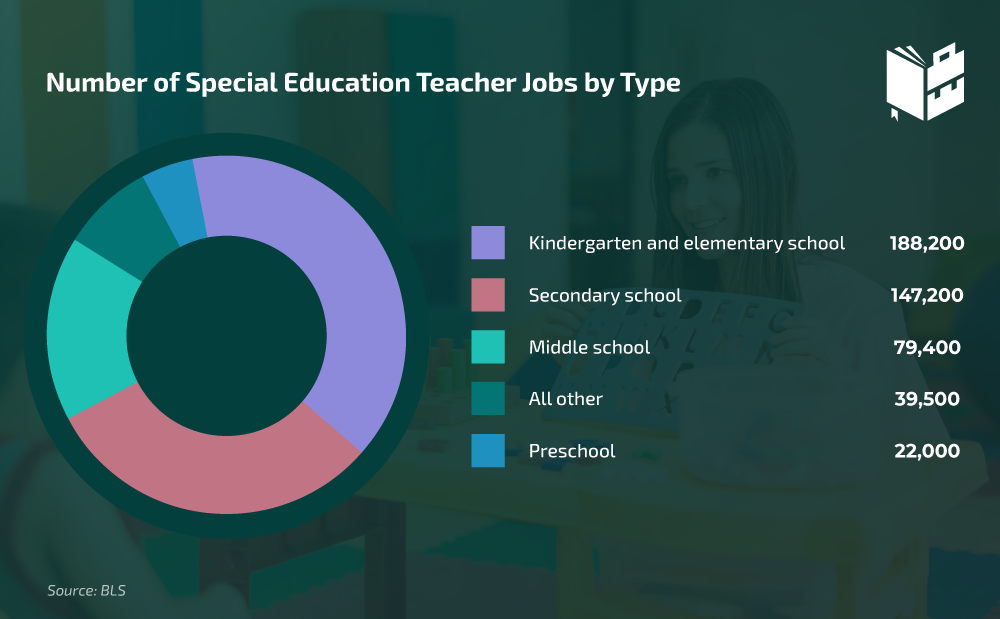
Special education teachers held about 476,300 jobs in 2021.
Most, or 188,200, worked in kindergartens and elementary schools, while 147,200 were employed in secondary schools.
Special education teacher jobs are expected to grow by 4% from 2021 to 2031.
It’s expected that approximately 37,600 openings will be available for special education teachers each year, making the special education teacher a desirable career choice.
Learning Disabilities Statistics
What are the top 5 learning disabilities?
The five most common disabilities in schools are specific learning disabilities, speech or language impairment, other health impairments, autism, and developmental delay.
9.8% of US children have ADHD.
Usually diagnosed during childhood, ADHD is the most common neurodevelopmental disorder. According to the latest children with disability statistics, 6 million or 9.8% of kids in the US have been diagnosed with this disorder. Of these, 265,000 children are 3–5 years old, 2.4 million are 6–11-year-olds, and 3.3 million are 12–17.
Six in ten children with ADHD have at least one other disorder.
A national parent survey showed that it’s common for children with ADHD to have another mental, behavioral, and emotional disorder. For example, around half of them have a behavior problem, and about three in ten have anxiety.
Data further shows that boys (12.9%) are more likely to get diagnosed with ADHD than girls (5.6%).
Dyspraxia is likely to affect as many as 6% of children.
The prevalence of learning disabilities, such as dyspraxia, or developmental coordination disorder (DCD), is hard to determine. However, according to the latest estimates, 6% of children are diagnosed with this condition. The data also shows that boys are four times more likely to be affected by it than girls.
One in ten Australian students have a disability.
37% of them say that they need more support, while 77% of them report having difficulties at school.
1.49 million UK students need special education.
This figure translates to 16.5% of students in the UK and signifies a meaningful decrease from 21.1% in 2010.
There are 1,171 special needs education schools in Japan.
The vast majority of these schools are local government-established facilities, while 15 of them are private schools.
The number of students with learning disabilities who spent time in regular classrooms doubled from 1989 to 2020.
The percentage of special education students in an inclusion classroom more than doubled between 1989 and 2017. In 1989, the percentage of students with special needs who spent at least 80% of their time in regular education classrooms was 31.7%. In 2020, this number rose to 66%.
Students With Disabilities Statistics
Nearly 17% of children in the US has a form of developmental delay.
The percentage of students with disabilities has been on the rise for the past two decades. In addition, according to the developmental delay prevalence data, boys are twice more likely to have a developmental delay than girls, especially in terms of ADHD, learning disabilities, and autism.
18% of students who receive special ed are male.
In comparison, only 10% of school-age students who receive special education services under IDEA are female.
Regarding services for specific learning disabilities, 42% of female students receive them, while the same applies to only 31% of their male counterparts.
According to education statistics, 15% of male special ed students are receiving services for autism, while the same applies to only 6% of female students.
11.5% of students with disabilities have been diagnosed with autism.
The above figure translates to around 828,338 children and marks a significant increase since 2000, when only 1.5% of students had the autism spectrum disorder (ASD). Furthermore, learning disabilities statistics indicate that boys are around five times more likely to have this disorder than girls.
What percentage of school-aged children does the federal government classify as visually impaired?
0.4% (or 25,565) of all children aged between three and 21 who receive special education have been classified as visually impaired.
12.8% of college students reported having attention deficit disorders.
Based on a sample of 53,745 college students, it has been determined that 6,858 college students have been diagnosed with ADD/ADHD. Moreover, 4.7% of the surveyed college students claim to have at least one learning disability.
Read more: Best Colleges for Students with Learning Disabilities
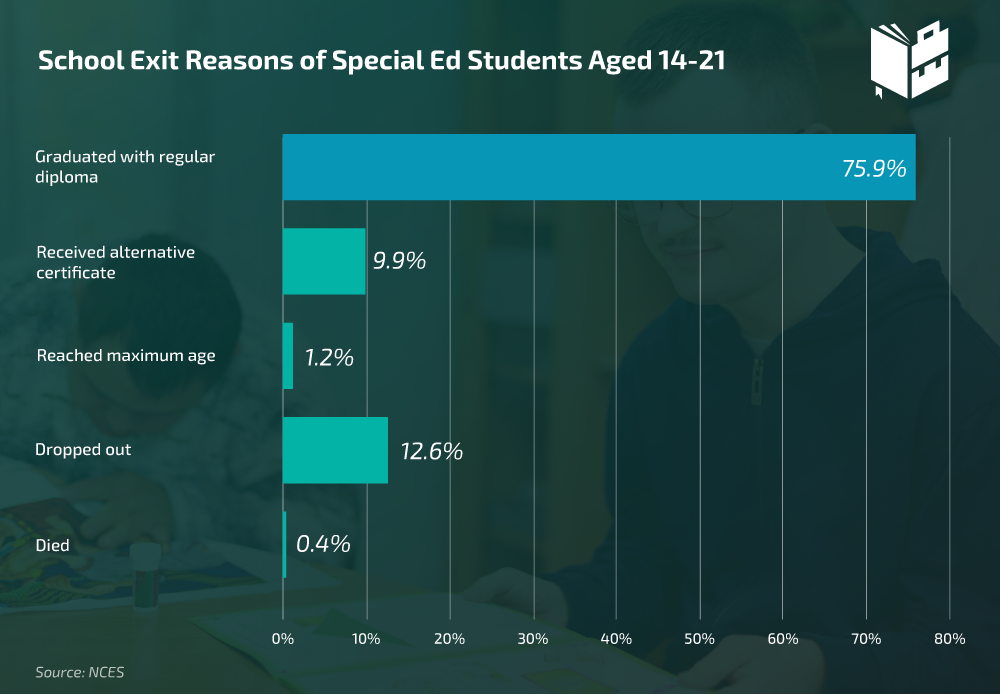
75.9% of students with disabilities aged 14-21 graduated with a regular high school diploma in 2020.
9.9% of them received an alternative certificate, while 12.6% dropped out of school. The rest left school for a variety of reasons which include reaching the maximum age, passing away, transferring to regular education, or moving.
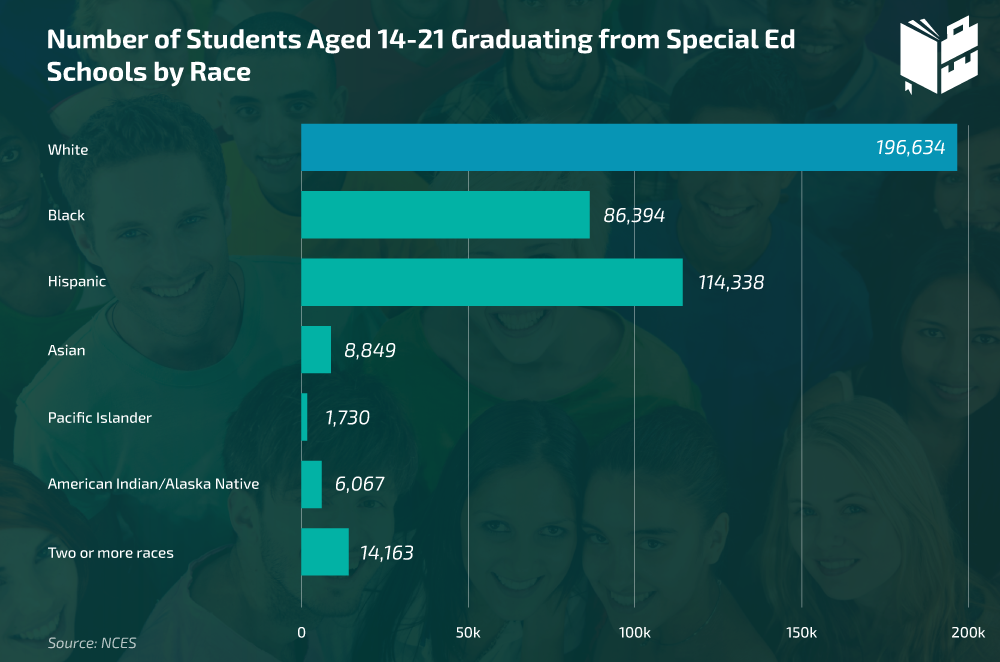
White students had the highest percentage of people graduating with a regular high school diploma (79%), while Black and Pacific Islander students had the lowest percentage, with 72% each.
89% of students with speech or language impairments graduate high school with regular diplomas.
Students with multiple disabilities have the lowest chance of graduating with a high school diploma since only 44% of them managed to do so.
However, students who have intellectual disabilities and multiple disabilities have the highest rates of leaving high school with an alternative certificate, with 34% and 33%, respectively.
Special Education Statistics by State
At 20.5%, New York has the largest percentage of students with disabilities enrolled in public schools.
Maine and Pennsylvania follow with 20% and 19.9%, respectively.
On the other end of the spectrum, the percentage of students with special needs goes as low as 11.3% in Texas and Hawaii.
The number of disabled students since 2000 grew 62.5% in Nevada.
The number of special education students by state data reveals that all but 14 states saw growth in the number of disabled students since the 2000–01 school year.
On the other side of the spectrum, Rhode Island experienced a significant decline of 22.1% during the same period.
22 states meet IDEA requirements regarding serving 3-21-year-old students with disabilities.
North Dakota, Tennessee, and Utah will likely join these 22 since the government officially states that these three need one-year assistance to meet IDEA’s requirements fully. None of the states need an intervention.
Special Education Statistics by Race
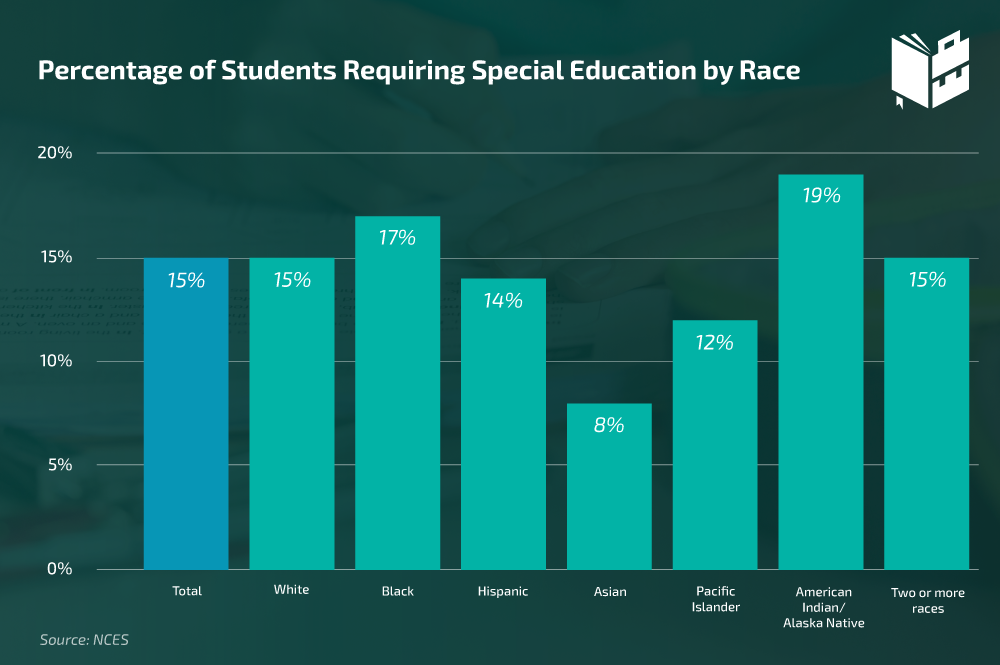
19% of American Indian students are attending special education classes.
17% of Black students and 15% of White students aged 3-21 can say the same. On the other hand, only 8% of Asian students are served under the Individuals with Disabilities Education Act.
Most Asians with disabilities have Autism (27.1%)
Percentage-wise, the second and third disabilities among Asian students aged 3-21 are speech or language impairments and specific learning disabilities, with 24.2% and 18.1%, respectively.
39% of Hispanic special education students have specific learning disabilities.
The same can be said for 21% of White students, while 34.8% of Black students served under IDEA report having at least one of the specific learning disabilities.
Final Thoughts
Although the government regularly increases the allocated budget for special education, the needs of special ed students still need to be met in all 50 states. These special education stats can shed some light on the current state of the entire education system and provide input on making special education an enjoyable and productive experience.