This year has been a significant challenge for both companies and employees, and various job statistics prove this fact. The unemployment rates have finally started to stabilize, and more people work from their homes than ever before.
It’s essential to stay informed and find the latest data regarding the job market, its growth, employment, new trends, and demographics. That’s why we’ve gathered everything you need to know about jobs in one place.
Now, let’s look at the most important figures regarding jobs and employment and how they affect the economy.
Most Important Job Trends and Stats (Editor’s Choice)
- The nonfarm payroll employment increased by 638,000
- There are 8.8 million veterans in the labor force
- In September, 9 out of 100 people aged 75 or older were employed
- Donald Trump created 4.7 million jobs
- 77% of survey respondents claim illegal immigrants do the jobs they don’t want
- The highest fatality rate is among the logging workers
- Six million new jobs are likely to become available over the next nine years
- The highest employment rate among the ones aged 15 to 24 was in Western and Northern Europe
Job Statistics
Statistics about jobs are changing drastically every month. The current job market data can’t be compared to those from the beginning of 2020. In this section, you will find information about what has changed in the job market and what has stayed the same.
1. The minimum wage in 2020 remained $7.25 per hour.
(Trading Economics)
Even though the US has endured two serious crises from 2008 until today, various job data shows there’s one thing that remains unchanged — the minimum hourly wage.
Reports indicate that the minimum rate per hour a worker can earn in 2020 amounts to $7.25. That also marks an all-time high hourly rate that has been consistent for the past decade.
2. Hourly earnings in the US reached $29.50 in October 2020.
(Trading Economics)
Private-sector production employees received an average hourly pay of $24.82, marking an increase of about 5 cents.
Even though we are amid a pandemic, various US job statistics point out that employees’ hourly wages on private nonfarm payrolls rose by 4 cents and, as of October, these employees earn $29.50.
It’s currently very challenging to create an accurate analysis of the recent, current, and future trends due to large employment fluctuations caused by the worldwide pandemic.
3. The nonfarm payroll employment increased by 638,000 in October.
(BLS)
The US Department of Labor issued a report in November stating that the US job numbers increased and total nonfarm payroll employment rose by 638,000.
These are fantastic news since the labor market significantly improves each month, reflecting a resumption of economic activity throughout the nation.
4. The number of full-time employees increased by 1.2 million in October.
(BLS)
The number of US employees who usually work full-time increased to 123.6 million. There is also an increase in the number of part-time workers. It rose by 1 million to 26.2 million.
5. Real average hourly earnings grew by 0.1% from September to October.
(BLS)
Moreover, job stats show a seasonal increase of 3.2% in average hourly earnings and an increase of 4.4% in average weekly earnings from October 2019 to October 2020.
6. There are 8.89 million veteran men and women in the US labor force.
(BLS)
The total number of jobless US veterans eligible to apply for a state’s unemployment insurance program or the UCX amounts to 689,000.
According to the official jobs statistics across the states, veterans take up 8.89 million of the total US labor force.
Around 7.89 million of them are men, while a bit more than 1 million are women. In terms of unemployment, 5.6% of men and 5.0% of women are currently without a job.
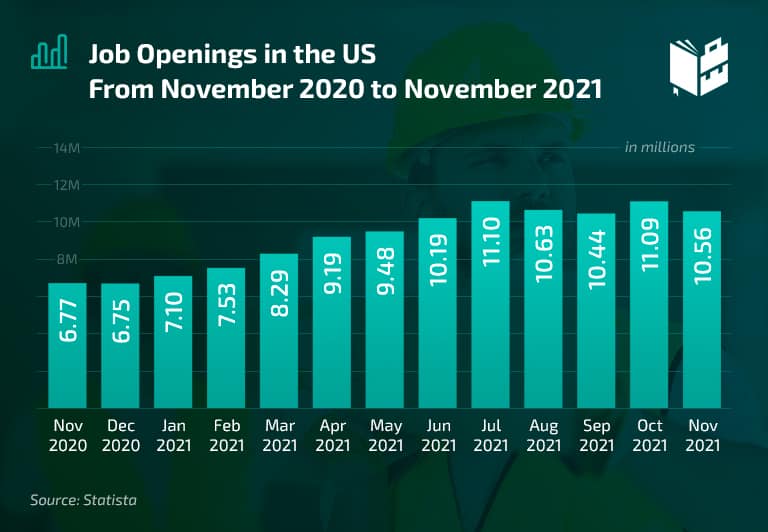
7. There were 6.44 million job openings in September.
(Statista)
The US saw a slight increase in the number of job openings in September. It was a slight increase from August when there were 6.35 million job openings. It’s important to note that this data is seasonally adjusted.
Job Statistics by Rates and Demographics
The US workforce is very diverse, and some jobs are more suitable for specific age groups. Also, the education level is one of the most vital factors when finding a job is in question. Even gender can play a significant role in job search and salary range. The statistics below will tell you more about it.
8. Nine out of a hundred people older than 75 were employed in September.
(Advisor Perspectives)
Many participants in the US labor force are older than 50. Job demographics show that the biggest group consists of the people aged 50 to 54 — 79 employees out of a hundred people.
9. In August, 21% of Hispanic or Latino US citizens were neither in the labor force nor wanted a job.
(ILR)
The coronavirus pandemic has unequally disrupted people of different races and ethnicities. One of the exceptions is Asian people because -2% of them didn’t want a job. Moreover, around 14% of them weren’t in the labor force, but they searched for a job.
10. The job participation rate in the US increased by 0.3% in October.
(Statista)
According to the newest jobs reports, the US labor force’s participation rate increased to 61.7% last month. However, this percentage was higher in February 2020, when the US civilian labor force participation rate was 63.4%.
11. Donald Trump created 4.7 million jobs during his presidency.
(Statista)
Donald Trump was a president from 2017 to 2020 and created almost 5 million jobs, according to Statista’s job creation statistics.
This data also shows that Donald Trump created the smallest number of job positions than any US president since 1993.
12. The number of teenagers participating in the labor force decreased from around one-half to one-third of the population.
(CNBC)
There has been a decrease of 17% of teenagers participating in the US labor force since 2000. Nevertheless, this doesn’t mean that today’s teenagers are idle and uninterested in work.
According to teenage job statistics from this year, 35% of teens aged between 16 and 19 are a part of the US workforce. The reason for this is their devotion to education. High schools have become more demanding, and teenagers are mostly focused on learning rather than working.
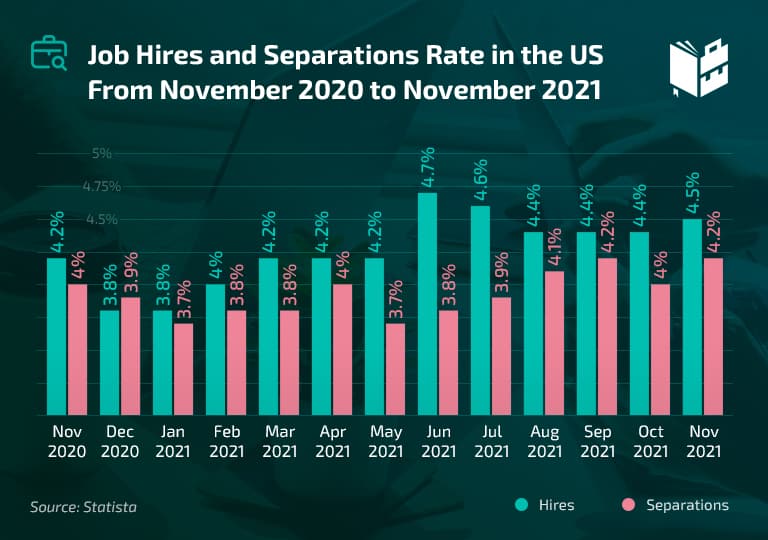
13. The occupational separation rates were 9.7% in March 2020.
(Statista)
The occupational separation rates reached their peak in March 2020, when they stood at nearly 10%.
The same data points out that the total job separation rate (also referred to as the turnover rate) was 3.3% in September, and the data are seasonally adjusted. This figure includes voluntary quits, involuntary layoffs and discharges, retirements, and other separations.
14. In September 2020, the hiring rate in the US was at 4.1% for total nonfarm.
(Statista)
The statistics show that hiring rates slightly decreased after August. The situation has started to stabilize, and hiring rates are now higher than they were in September 2019.
Occupational Employment Statistics
The last couple of years have been quite successful for America regarding employment rates. They have been rising in most states, and many sectors have recorded a healthy demand for new positions. Moreover, the latest statistics show that wages have been increasing regularly. Let’s see what the numbers can tell us.
15. Home health aides and personal care aides are projected to add 1.15 million new jobs by 2029.
(BLS)
US employment by occupation depends on having at least a high school diploma, formal training, and passing a standardized aide test.
Perhaps the low education levels are a reason this occupation is the most demanding right now, as many people can’t go to colleges or universities. These professionals will have the greatest job offer on the market.
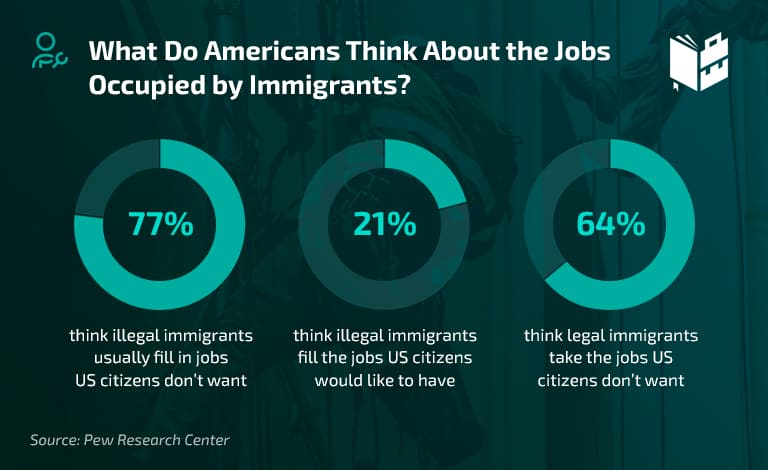
16. 77% of survey respondents think that illegal immigrants usually fill in jobs US citizens don’t want.
(PewResearch)
There are plenty of Illegal immigrant job statistics and reports that can give us an insight into what Americans think about hiring illegal immigrants.
A majority of survey respondents claim illegal immigrants take the jobs Americans don’t want to do, while 21% think illegal immigrants fill the jobs US citizens would like to have. On the other hand, 64% of survey respondents think that legal immigrants take the jobs US citizens don’t want.
17. An elevator mechanic is a trade job in demand with the highest median wage of $38.21 per hour.
(Kenrusk)
Elevator mechanics are currently in demand. According to many trade job statistics, they make $38.21 per hour. Some other paying trade jobs are dental hygienist and electrician, with median wages of $35.61 and $26.01 per hour, respectively.
The only qualifications an elevator mechanic needs to have are a high school diploma and a license. However, elevator mechanics might have trouble finding a job in bigger cities, even when the demands are high.
18. Logging workers have the highest fatality rate of all jobs.
(Marlin)
Among the highest job fatality rates, logging workers are on the top of the list, with 97.6 fatal work injuries per 100,000 workers. That undoubtedly makes it the deadliest job in 2020.
Most injuries occur because employees get in contact with dangerous machines or get struck by a falling tree or a log.
Industry experts search for ways to keep logging workers safe. That’s why they recommend wearing safety equipment and try to improve machines.
Current Job Trends and Future Predictions
The average workweek hours seem to be shortening continually, with the decreasing demand for tech jobs and the rising number of jobs lost to automation. These negative trends are somewhat unexpected and quite worrying, especially for the labor force. Some new trends are connected to remote work and virtual communication. Here, you can find out more about the trends and predictions.
19. By 2030, about 60% of job growth will be concentrated in 25 cities.
(McKinsey)
Job growth statistics reveal that megacities in the US account for nearly 44% of all employment today, with reports suggesting an 11% growth rate for the next ten years.
Due to automation increasing, the need for displacement also rises, which would mean that many people could be relocated for company purposes.
Job growth by year statistics show that around 60% of the job growth could be concentrated in only 25 major cities alongside their peripherals.
20. Six million new jobs are expected to become available over the next nine years.
(BLS)
This job growth data published on September 1, 2020, suggests an annual growth of only 0.4%, which is slower than the previous ten-year estimate period.
In some occupational groups, employment will grow faster than the average, such as computer and mathematical occupations, healthcare support occupations, and community and social service occupations.
21. By 2028, around 73% of all departments will have remote workers.
(UpWork)
According to many sources, one of the most popular and influential job market trends in 2020 is remote working.
Some experts claim that all departments will have even more remote workers because of the 2020 events. It seems that younger managers are more likely to believe in the advantages of the independent workforce approach.
22. 44% of the skills employees will need to perform their roles efficiently will change.
(WeForum)
Some of the new job opportunities are connected to the care economy jobs. Many organizations plan to transfer 46% of workers from their current jobs to emerging job positions.
Other Interesting Job Market Statistics and Facts
Many external factors influence the job market and its trends. We’ve compiled the most interesting statistics and facts related to jobs, factors that affect hiring decisions, and the impact a job can have on a person’s wellbeing.
23. 79% of all businesses have rejected an applicant because of their social media activity.
(Martech Series)
Upon reviewing applications, 90% of recruiters would check out the candidate’s social media presence. One of the well-known job facts is that 80% would decline a candidate if their social media activity is filled with inappropriate content.
Social media is among the top assets used by HR professionals when scouting for potential candidates.
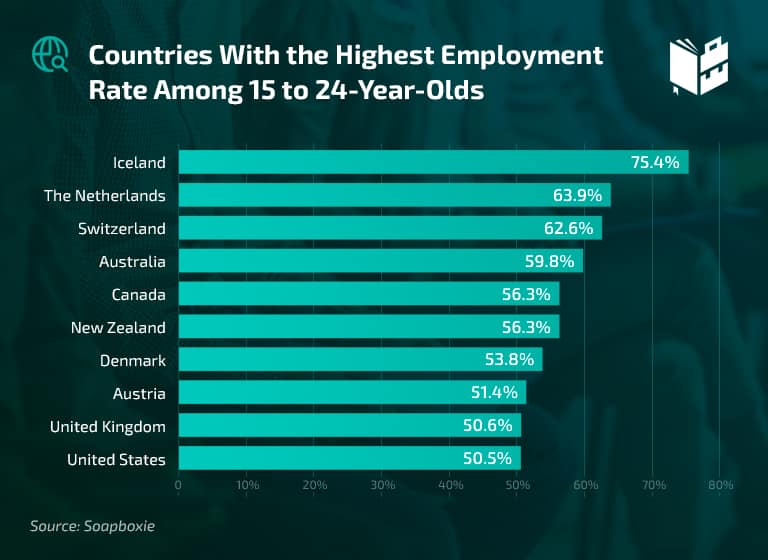
24. The highest employment rate among the ones aged 15 to 24 was in Northern and Western Europe.
(SoapBoxie)
The highest employment rate of individuals aged between 15 and 24 was recorded in Iceland, with an employment rate of up to 75,4% in 2018. Netherlands and Switzerland were right after Iceland, with an employment rate of 63,9%.
25. The job with the highest suicide rate among males is from a Farming, Fishing, and Forestry occupational group.
(CDC)
Statistics show that suicidal rates of men belonging to a Farming, Fishing, and Forestry occupational group, especially anglers and hunters, are the highest. Machinists are right after them, followed by soldering, welding, and brazing workers.
The highest suicide rates in females are recorded in art-related occupations (including entertainment, design, media, and sports).
26. An average office chair with wheels travels around 12.5 km per year.
(Corporate Challenge)
Office chairs with wheels are very practical, and because of that, they travel over 12 km every year, along with the workers who use them.
Job Statistics — Conclusion
Staying up to date with the latest employment reports is vital for both job seekers and employers. They’re also helpful to students deciding on their next step of education while keeping in mind future job opportunities.
The latest trends indicate that times are changing across America and, even though the demand for specific roles is decreasing, there’s a vast diversity in hiring trends and a modest growth of the labor force.
These stats show that the job market and the economy are changing exponentially, registering more positive than negative future trends.