The job growth by year indicates a country’s economic strength and is a good measure of economic expansion. Therefore, job creation should be every government’s top priority, as financial stability depends on the country’s employment rate.
However, the coronavirus pandemic and protective measures changed the optimistic outlook and halted economic growth. As a result, many people lost their jobs, the number of job postings dropped, and employees shifted to remote work. It’s safe to say that these are tumultuous years for job growth.
How does the pre-pandemic job growth compare to that of 2022? What does the future hold? Let’s dive into this article to find the answers.
Job Creation by Year Statistics (Editor’s Choice)
- In the US, 25 cities will capture 60% of job growth by 2030.
- Around 11.9 million jobs will be available by 2030.
- A total of 621,000 jobs were added in the education and health services sector in 2019.
- Good producing industries added 188,000 jobs in 2019.
- In April 2020, job growth in the leisure and hospitality sector plummeted by 47%.
- In June 2020, the nonfarm payrolls increased by 4.8 million.
- President Clinton added 18.6 million jobs during his term.
- The number of nonfarm payroll jobs increased by 528,000 in July 2022.
Job Growth Over the Years
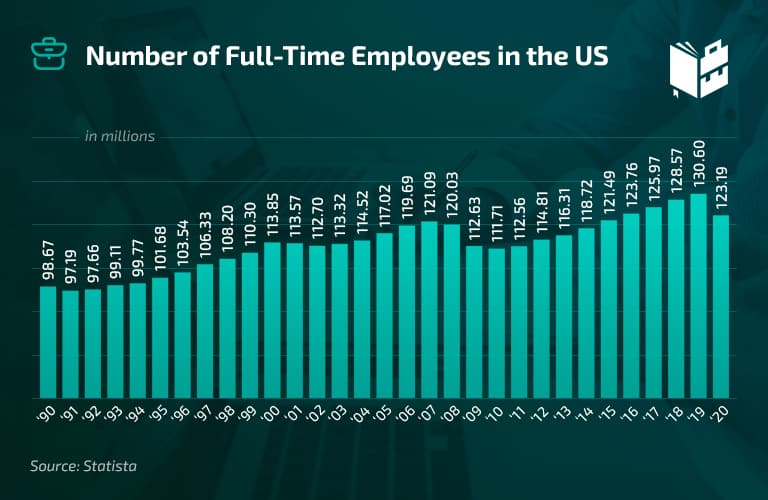
1. The number of full-time workers increased by almost 30 million between 1990 and 2021.
(Statista)
Annual job growth data from Statista show that only 98.67 million people had full-time jobs in 1990, and that number increased to 127.16 million in 2021. After the recession, the number of full-time jobs decreased, while the number of part-time jobs increased significantly.
2. Around 2.1 million manufacturing jobs will be needed by 2030.
(Deloitte)
The data on manufacturing trends and job growth statistics by year show that 4 million manufacturing positions will be available by 2030, either due to the expected growth in manufacturing or vacant positions due to retirement. However, only 1.9 million are likely to be filled.
The top reasons for the skill shortage include different expectations from new entrants for jobs and careers (38%), lack of interest in the industry (36%), and the retirement of baby boomers (34%).
3. In the US, 25 cities will capture 60% of job growth by 2030.
(McKinsey)
At the moment, 25 megacities account for about 44% of all employment. According to job growth statistics by city, that percentage will grow over the next nine years. The main reason for such a significant increase is the automation-related displacement.
4. About 11.9 million jobs will become available by 2030.
(BLS)
This represents an annual growth of 0.7%, which is higher than recent projections and plans for recovery since the pandemic. Still, job statistics on US job creation by year show that employment will grow faster than the average in some sectors like leisure and hospitality, while healthcare and social assistance will reach the highest number of new jobs.
5. 3.3 million healthcare support and social assistance jobs will be added by 2030.
(BLS)
The healthcare industry is expected to see the biggest job growth in the upcoming years. According to estimates, 3.3 million healthcare and social assistance jobs will be created by 2030 ,with the individual and family services industry experiencing the highest growth (3.3%). Moreover, seven out of the 30 fastest-growing occupations will belong to the healthcare sector.
Pre-Pandemic Job Growth Statistics
6. In 2019, the nonfarm payroll expanded by 1.4%.
(BLS)
BLS numbers show that the nonfarm payroll expanded by 2.1 million. In terms of average monthly job gain, 2019 was the weakest since 2010, with a job gain of 178,000. It resulted from the decline in real gross domestic product growth, which was 2.3% in 2019, down from 2.9% in 2018.
7. Just 20,000 jobs were created in February 2019.
(MSNBC)
According to MSNBC’s job growth data, the US had the worst job growth in February 2019. Before the reports came in, most economists had projected around 180,000 new jobs. However, the result didn’t meet expectations. Economic analysts still haven’t figured out the main reason for such a devastating result.
8. In 2019, 621,000 jobs were added in the education and health services sector.
(BLS)
Data on job growth by year reveals that education and health services experienced significant job growth, adding 160,000 jobs more in 2019 than in 2018. Moreover, 352,000 additional jobs in the healthcare industry accounted for 16.5% of the total nonfarm employment increase in 2019 — 10.9% more compared to 2018.
9. In 2019, the leisure and hospitality industry added 144,000 more jobs than in 2018.
(BLS)
Furthermore, the average job growth rate shows that food services and drinking places had 250,000 new jobs YoY, with 71% jobs added in the second half of the year. What is more, these jobs accounted for 11.7% of all added nonfarm jobs.
10. The government sector added 184,000 jobs in 2019.
(BLS)
According to recent data on job growth by year, this expansion was primarily led by the local government job growth, resulting in 135,000 more jobs in 2019 than in 2018 (114,000).
11. In 2019, good-producing industries added 188,000 jobs.
(BLS)
Employment growth slowed down in goods-producing industries. In 2019, the sector added 434,000 fewer jobs than in 2018. Manufacturing is also one of the sectors where job growth significantly slowed down in 2019. The industry added only 61,000 jobs, which is less than a quarter of the 264,000 added in 2018.
12. Real estate and rental and leasing acquired 66,000 jobs in 2019.
(BLS)
The number of jobs created by year in the rental and leasing industries was similar to those of the previous three years. The finance and insurance employment rate was also similar to that of 2018 — 83,000 compared to 105,000.
13. In 2019, the retail industry had 248,000 fewer jobs than in January 2017, when employment was at its peak.
(BLS)
Clothing and accessories stores lost 46,000 jobs in 2019. Furthermore, miscellaneous store retailers lost 24,000 jobs, whereas department stores lost 43,000 jobs in the same period. The job loss in 2019 is connected with the 60% increase in store closures.
The US Job Growth Rate After the COVID-19 Outbreak
14. In April 2020, job growth in the leisure and hospitality sector plummeted by 47%.
(BLS)
The leisure and hospitality industry was hit the hardest after the measures to stop the pandemic spread came into effect. Then, employment in the sector decreased by 7.7 million. Moreover, a significant decrease was noted in food services and drinking places, which lost 5.5 million jobs. The arts, entertainment, and recreation sectors lost 1.3 million jobs, whereas employment in the accommodation industry decreased by 839,000.
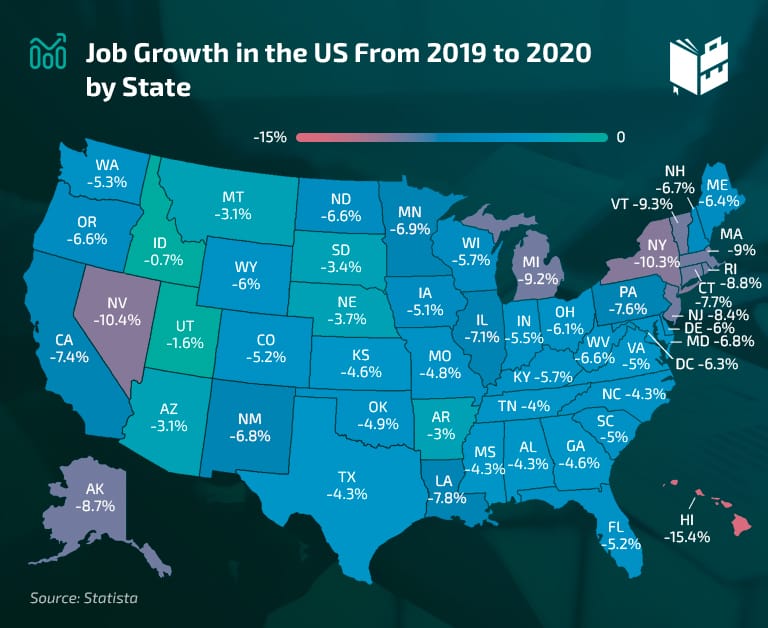
15. With 15.4%, Hawaii experienced the most significant decline in job growth between 2019 and 2020.
(Statista)
According to job growth statistics by state, all states experienced a significant decline due to the COVID-19 pandemic. Job growth in Idaho and Utah decreased by 0.7% and 1.6%, respectively. Alabama, Texas, Mississippi, and North Carolina faced a decline of 4.3% each. The most notable decline happened in Hawaii, followed by Nevada (10.4%) and New York (10.3%).
16. In April 2020, the economy lost 20.5 million jobs.
(BLS)
As businesses started shutting down in the wake of the COVID-19 pandemic, the unemployment rate reached 14.7%. The job growth per year rate was at its lowest month-to-month level since January 2011.
17. Employment in child care services plummeted by 336,000.
(BLS)
Overall, the social assistance sector noted a decline of 651,000 jobs. Moreover, employment in private education fell by 457,000 in April 2020, whereas individual and family services faced a loss of 241,000 jobs. However, new job opportunities open for special education teachers regularly.
18. Employment declined by 1.4 million in the healthcare industry after the COVID-19 outbreak.
(BLS)
The healthcare industry was also one of the sectors that were hit the hardest by the coronavirus outbreak. Job gains by year decreased by 1.4 million in April 2020, with dentists’ offices noting the most significant decline of 503,000. Furthermore, physicians’ jobs number fell by 243,000, and other healthcare practitioners saw a decrease of 205,000 jobs.
19. The nonfarm payroll employment rose by 6.7 million in 2021.
(BLS)
The job creation by year numbers show that the nonfarm payroll expanded by 6.7 million between 2020 and 2021, representing the strongest relative gain since 1978 (4.7%). The most notable growth was in the leisure and hospitality (2.4 million) and the professional and business services sectors (1.1 million).
20. State and local government employment has decreased by 597,000 million jobs since February 2020.
(BLS)
State government employment experienced a significant drop during this period — 2.6%. Looking closer at the US job growth rate for the local government, we can see that there are 555,000 (3.8%) fewer jobs in this sector than before the pandemic.
21. In June 2020, the nonfarm payrolls increased by 4.8 million.
(CNBC)
Following the US reopening from the pandemic in June 2020, the nonfarm payrolls rose much more than the expected 2.9 million. What is more, the unemployment rate fell to 11.1%, which is also better than the projected 12.4%.
22. The leisure and hospitality industry gained 2.1 million jobs in June 2020.
(CNBC)
The leisure and hospitality industry had a rising job growth rate by year before the pandemic halted it. However, the numbers increased again after the economy resumed in June 2020, when the industry accounted for 40% of the total job growth.
Furthermore, employment in the retail trade sector also increased, adding 740,000 jobs. Education and health services gained 568,000 jobs, and other services added 357,000 jobs.
23. The employment rate increased by 661,000 in September 2020.
(BLS)
Deeper into 2020, the economic activities resumed, and the job growth outlook improved. In September 2020, the unemployment rate declined to 7.9%. Moreover, leisure and hospitality experienced the most significant employment increase during that month, adding 318,000 jobs.
Job Growth in 2022
24. There were 456,000 more job openings in July 2022 than in July 2021.
(BLS)
The labor market didn’t observe any drastic changes at the end of July 2022. There were 11.2 million new job positions, which is only slightly higher than the number from July 2021 (10.8 million). Moreover, the transportation, warehousing, and utilities sector saw the highest monthly increase in new job positions (81,000).
25. The current unemployment rate is 3.5%.
(BLS)
The coronavirus pandemic has had a vast influence on the unemployment rate in the US. Luckily, the situation is slowly getting better in 2022. According to job creation statistics by year, considerable job gains occurred in the following sectors — leisure and hospitality, business and professional services, and health care.
26. Nonfarm payroll employment increased by 528,000 in July 2022.
(BLS)
The number of new nonfarm payroll jobs in July was higher than the average monthly gain of the previous four months (388,000). The growth was most conspicuous in leisure and hospitality, professional and business services, and healthcare sectors. Interestingly, the job positions growth returned to its February 2020 pre-pandemic level, though several sectors are yet to recover.
27. There was a record gap of five million more job openings than unemployed people in February 2022.
(CNBC)
According to data on job growth by month in 2022, there were about 11.3 million job positions and 6.3 million US citizens out of work in February, translating to 1.8 jobs per unemployed person. Education and health services had the highest count of job openings (2.2 million), followed by professional and business services (2.1 million).
US Job Growth by Year During Presidential Terms
28. President Clinton added 18.6 million jobs during his term.
(The Balance)
At the beginning of President Clinton’s term, 119 million people were employed. At the end of his term in December 2020, 137.6 million people had a job. He created 2.85% more jobs per year during his first term and 2.33% during his second term. Moreover, the number of welfare recipients fell by 59% — from 12.2 to 4.96 million people.
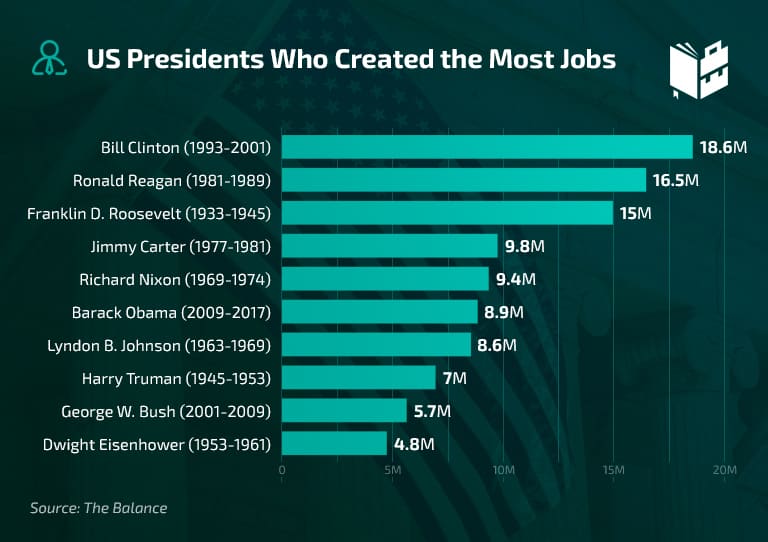
29. Bush could muster about 31% of Clinton’s feat with just 5.7 million new job opportunities.
(The Balance)
During President Bush’s first term, there were only 0.02% of new jobs created by the year. During his second term, he added 0.24% of new jobs. However, these numbers are highly impacted by the recessions during which he led the country. During his last year in office (2008), he lost about three million jobs.
30. Obama improved on Bush’s record, taking it to 8.9 million in eight years.
(The Balance)
Coming post-recession, President Obama created the American Recovery and Reinvestment Act. Between June 2009 and December 2016, he created 12.2 million jobs, adding 0.22% new jobs by year during his first term and 1.86% during his second term. In total, the workforce increased by 8.7% after the end of Bush’s administration.
31. Donald Trump ended his presidential term with 142.6 million jobs, 10 million fewer than before the pandemic.
(Reuters, Trump White House)
During his presidential term, Donald Trump decreased the unemployment rate to a 50-year low, and the number of jobs created by year was at a record high. America gained 7 million new jobs, taking the number of employed Americans to 160 million. However, things changed after the coronavirus stroke, forcing job loss all over the country.
32. The US economy has gained 9.5 million jobs since President Biden’s term started.
(CAP, JEC)
This is a record-high for the first 17 months of any presidency. Moreover, the unemployment rate reached the lowest number in 50 years in July 2022 (3.5%). The latest reports also claim that the US has recovered all jobs lost because of the pandemic, a direct result of the American Rescue Plan and other pandemic relief.
Job Growth by Year Statistics — The Future Outlook
In the post-epidemic economy, the US government works hard to lower the unemployment rates, support workers, and facilitate hiring. Even though the COVID-19 crisis forever changed the market landscape and how people work, agile and adaptable industries will recoup fast.
Additionally, certain positions like wind turbine service technicians, nurse practitioners, occupational therapy assistants, and statisticians are poised to grow rapidly in the next decade, employing more people than any other occupation.