There is not one person on this planet who hasn’t considered changing their career path at one point in their lifetime. According to career change statistics, such a decision is completely natural. Nobody’s born knowing what career fits him best.
Discovering a job that gets you excited to wake up daily and go to work with your lips curved into a genuine smile is no easy feat. As such, it comes as no surprise that everyone switched jobs at least once in their adulthood.
Therefore, if you find yourself in similar circumstances, we’ve got you. Here is some enlightening information to help guide you.
Essential Job Change Statistics (Editor’s Choice)
- People switch their career plans roughly five to seven times.
- 29% of US citizens have switched to another career since their first job.
- 53% of American college graduates use half or less of their education at work.
- Americans between 25 and 34 stay for 2.8 years at a job on average.
- 32% of US individuals are not content with their current job.
- Women in the US keep one job for 3.9 years.
- Almost 50% of US teachers considered changing careers after the COVID-19 outbreak.
- 32% of US workers searching for a new job want to switch to another industry.
- 52% of millennials and Generation Z are likely to search for new employers in 2022.
Average Career Changes in the US
A person’s change of career rate depends on many different factors and situations. Some of these determinants are sex, age, and many more. Every single one has an impact on mid-career changes.
1. People switch their career plans 5–7 times during their lifetime.
(Careers Advice Online)
As our lives go on, we learn and grow. As such, we evolve and discover new talents, which could determine us to change our careers. According to stats on the average number of careers in a lifetime, an average individual swaps workplaces in the US from five to seven times. This number, however, is projected to grow over time as the number of job opportunities increases.
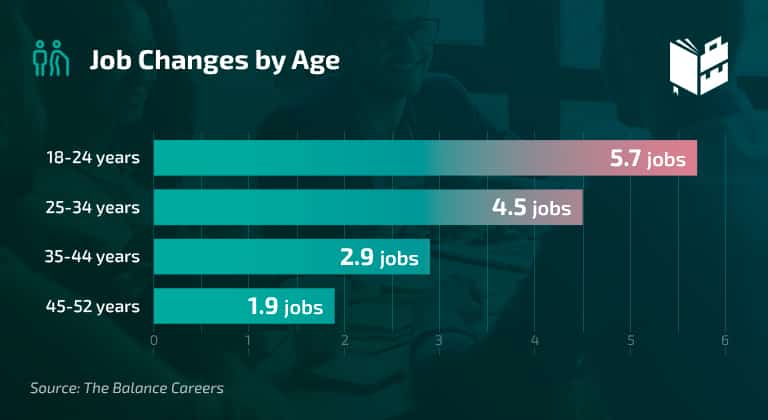
2. Baby boomers changed jobs over five times when they were between 18 and 24 years old.
(BLS)
Baby boomers’ average number of jobs was much higher when they were younger. As time progresses and we get older, the number of job changes we go through drops exponentially. Between 18 and 24, the boomer generation switched jobs 5.6 times, while the figure drops to 4.5 for the 25–34 period. Furthermore, they changed their workplace only 2.1 times when they were between 45 to 54 years old.
3. Roughly 12 career changes happen in a woman’s lifetime.
(BLS)
During their lifetime, men are said to hold 12.6 jobs. In comparison, the average number of jobs in a lifetime a woman holds reaches 12.3, despite most women taking days off due to particular circumstances like childbirth and childcare.
4. Men with a higher education change 11.9 jobs during their lifetime.
(BLS)
Men with bachelor’s degrees switch their career paths less frequently than those who only graduated high school. In contrast, women with higher education change jobs more often than those with a high school diploma.
Trends That Change Your Career Plan
Nothing is guaranteed in life. It’s something all of us learn one way or another. No one can guarantee that you’ll still be passionate about a profession after working in that specific field for years on end. As such, here are some statistics about career change trends.
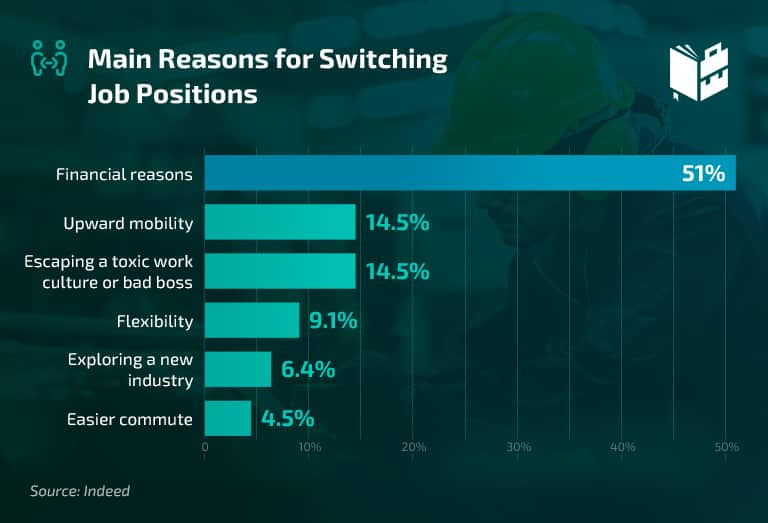
5. 14.5% of US individuals change their jobs because of upward mobility.
(Indeed)
Changing careers at 40, according to statistics, is not unusual. Moreover, in a survey performed by Indeed, 49% of responders named non-financial reasons for switching their positions, and 14.5% of these changed jobs because of upward mobility. Other reasons were desiring a healthy work environment (14.5%), flexibility (9.1%), and easier commute opportunities (4.5%).
6. 29% of US citizens have changed their career path since their first job.
(Edx)
In accordance with statistics on the average number of career changes, 29% of US individuals have changed their career path since they got hired for the first time. The reason behind this is the fact that young individuals strive to learn and evolve. Thus they are eager to change their job more frequently than older workers.
7. 53% of American college graduates use half or less of their education at work.
(Edx)
Taking into consideration career change statistics and the great value higher education has, it may come as a shock that barely 21% of college grads use all of their education at their job. Furthermore, around 15% reported not using any of the things they learned at college.
8. 32% of US individuals are not content with their current job.
(Civic Science)
Among the top reasons why someone would change careers is not being happy with their current job. Based on recent information on the matter, almost a third of American citizens are unsatisfied with their jobs. Moreover, 25% report they feel unfulfilled at work.
Average Career Length in the US
Every country has its own rates concerning the length of a career. In the US, the median number of years an employee works for a company depends on specific circumstances.
9. Americans aged 25–34 stay at the same job for 2.8 years on average.
(The Balance Careers)
Although the median number of years an American spends at a workplace is 4.1 years, this number varies depending on the age group. According to statistics on the average time we spend at a job, people aged 25 to 34 hold a job position for a little under three years.
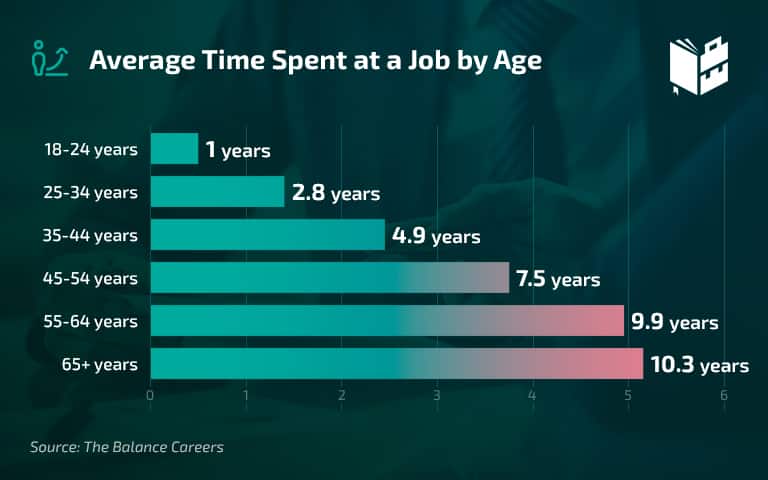
10. On average, a US employee who is over 55 works for the same company for 9.9 years before retirement.
(The Balance Careers)
As we get older and closer to the retirement age, the tendency to change jobs gets less and less appealing. As a direct result, the average time spent at a job increases from the median number nationwide of 4.1 to almost 10 years for those aged 55–64.
11. Women in the US keep one job for 3.9 years.
(BLS)
Based on a report by the BLS, the median time spent in a position for female workers is 3.9 years due to taking time off after giving birth. Furthermore, the average tenure for male individuals hasn’t changed since the year prior, standing at 4.3 years, according to a career change statistics report.
12. 29.2% of white Americans have been with their current employer for a decade.
(BLS)
Not only does age influence the tenure of individuals, but also does the ethnic group. Information on average career changes shows that almost 30% of caucasian US individuals stay with one employer for over a decade, while only 23.3% of African American workers stay that long.
Teacher Job Change Rate
Just like in many other professions, educators, teachers, and professors were heavily impacted by COVID-19. Even though classes haven’t been called off entirely, schooling isn’t quite the same as it used to be, based on education facts.
13. Almost 50% of US teachers considered changing careers after the COVID-19 outbreak.
(Edsurge)
A Teachers Pay Teachers survey shows that almost half of the participants considered changing the course of their careers when the pandemic started. Furthermore, based on job change statistics, 12% contemplated taking time away from their regular teaching job.
14. US teachers’ and principals’ stress levels are twice as high as that of the general working population.
(RAND Corporation)
It seems that the high stress levels in US teachers and principals are slowing down the pandemic recovery. While principals were stressed the most about staffing, the teachers took in additional students in their classrooms and covered classes due to staff shortages. In addition, female, mid-career, and Hispanic teachers reported the highest stress levels, career change statistics show.
15. Around 182,000 people in the education sector quit their jobs in January 2022.
(Money)
The number of teachers quitting their jobs has been on the rise recently. In January 2022, 182,000 people who work in educational services left their jobs, representing a 33.3% rise from January 2021, when 138,000 left. According to a Joblist survey, 40% of those who quit cited the pandemic as the main reason, while 26% left because of insufficient compensation and benefits.
Career Change Statistics 2022
The infamous 2020 was hard on all of us, without a doubt, but it also made us realize what was and what wasn’t important in our lives. As such, many made the decision to swap jobs and careers to feel happier and more fulfilled.
16. 32% of US laborers seeking a new job in 2022 want to switch to another industry.
(ResumeBuilder)
According to information on job change statistics, almost a third of American workers who plan to quit in 2022 think about changing careers. On the other hand, around 37% will search for jobs in the same industry, while 31% are undecided.
17. 48.3% of workers who quit in 2021 moved to another industry.
(Pew Research)
Based on Pew Research career change statistics, almost half of people who changed employers in 2021 moved to another industry. Moreover, 49.5% of those who quit changed their occupation entirely. On the other hand, only 4.2% of workers who found a new occupation stayed with the same employer.
18. 52% of millennial and Gen Z workers are likely to change employees in 2022.
(Microsoft)
Statistics on jobs state that over half of millennial and Gen Z laborers worldwide are likely to quit their current workplace in 2022, representing a 3% increase from 2021. On the other hand, only 35% of Gen X and boomer employees may do the same.
19. 83% of Brazilian teachers say they were not prepared to teach online.
(Blogs World Bank)
Brazilian education was hit by the COVID-19 restrictions just as hard as any other country. Based on a national survey, 83% of their teachers didn’t feel ready to teach their students online. Around 38% of the surveyed individuals felt exhausted, and barely 10% were content with remote teaching.
Conclusion
Considering all the facts and statistics mentioned above, it is evident that the majority of the world’s population took or intends to take the risk of swapping careers. Employed individuals are seeking financial stability, flexible hours, and other perks.
After examining dozens of job change statistics, we can confidently tell you that if you indeed find yourself in this position, there is no need to be alarmed.
COVID-19 made everyone reevaluate their goals. Consequently, it doesn’t shock us that a multitude of people worldwide swaps jobs or careers daily, trying to find the one that fits them most.
Keep in mind that sometimes taking a risk pays off.