We’re approaching the final months of this problematic year, and it seems like everybody is waiting for it to be finally over. Let’s discuss the latest unemployment trends to get a clearer picture of where we’re headed in 2021.
Before we continue with the stats and facts, we can briefly say that 2020 is definitely a year to forget. Not only did we get hit with a worldwide pandemic, but employment figures dropped to record-lows in such a short period.
So, can we truly say that we should feel optimistic about 2021? Let’s take a look at what the numbers say.
2020’s Unemployment Trends & Facts (Editor’s Choice)
- The lowest unemployment rate in US history was recorded in 1944 (1.2%)
- As of July 2020, the unemployment rate in California is 14.9%
- In August 2020, African-Americans faced an unemployment rate of 13%
- Hispanics face an unemployment rate of 10.5%
- 41% of all recent college graduates are currently unemployed
- 1.4 million new jobs were added to the US economy in August 2020
- The current unemployment rate stands at 8.4%
- Women’s unemployment rate stands at 9.1% as of September 2020
Unemployment Rates Throughout History
1. In 1929, the unemployment rate in the US was 3.2%.
(Source: The Balance)
Before the Great Depression started, the US unemployment rate was quite low. For the next 12 years, however, the unemployment rate stayed above the 10% mark. It was one of the darkest periods for American citizens, as many people lost their jobs and homes.
2. In 1933, the unemployment rate in the US was 24.9%.
(Source: Love To Know)
The highest point on the US unemployment rate chart was recorded halfway through the Great Depression. During this period, a quarter of those capable of working, or around 15 million Americans, could not find a job.
3. In 1941, the unemployment rate in the US was 9.9%.
(Source: Timeline)
As the economy started recovering, the US became embroiled in World War II. Roughly 16 million Americans had involvement in the war, which got the unemployment rate below 10% for the first time in a while. It took more than 40 years for the United States unemployment rate trend to exceed this unflattering milestone again.
4. In 1944, the unemployment rate in the US was 1.2%.
(Source: The Balance)
As the Second World War came to a close, the US was in major trouble again. Due to the lack of workers, businesses were unable to expand. This shows that low rates of unemployment are not necessarily a good thing. Research shows that companies often struggle to find workers when unemployment is below 4%, not to mention the struggles they had to go through with the lowest unemployment rate in US history.
5. In 1982, the unemployment rate in the US was 10.8%.
(Source: The Balance)
Another recession hit the US in 1980, and the consequences became fully apparent two years later when the unemployment rate exceeded 10% for the first time in over four decades. Luckily, this unemployment crisis didn’t last long.
6. In 2017, the unemployment rate in the US was 4.1%.
(Source: Forbes)
In 2017, as President Trump took office, the unemployment rate in the US was at the lowest point in over a decade. For now, as you’ll learn from the statistics listed below, unemployment is still on a declining trend.
Unemployment Trends Around the World
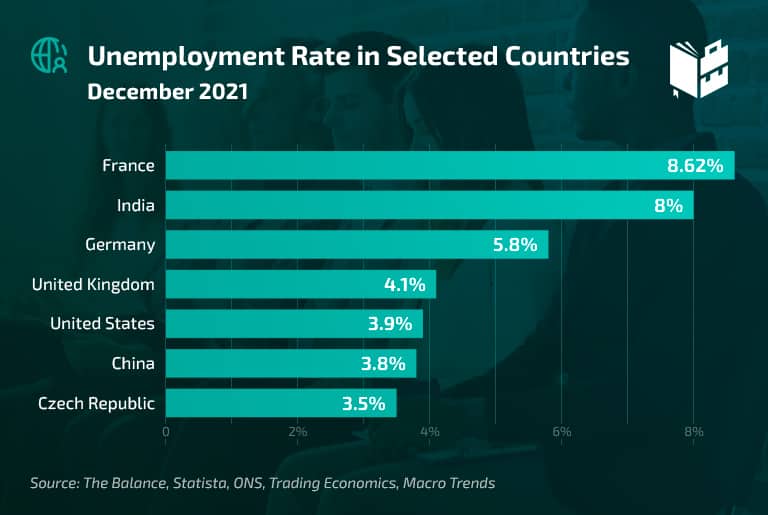
7. The unemployment rate in Germany is 5.2%.
(Source: Statista)
Germany, the fourth-largest economy in the world and Europe’s largest, has an unemployment rate of 5.2% in 2020. Even though this is not the lowest percentage the country has had since reunification in October 1990, it is still a very positive figure amidst the worldwide pandemic.
8. The unemployment rate in the UK is 3.9%.
(Source: ONS)
The fifth largest economy in the world, the United Kingdom, is neck and neck with Malta, Hungary, and Denmark when it comes to unemployment, according to this unemployment rate data. Currently, the unemployment rate across the United Kingdom stands at 3.9%.
9. The unemployment rate in the Czech Republic is 3.8%.
(Source: Trading Economics)
The Czech Republic holds the bragging rights for being the state with the most employed population in the European Union. The unemployment rate in this country has been declining since March 2013, when it peaked at 7.3%. However, the rate has increased since the start of the current pandemic, and remains at 3.8% as of July 2020.
10. The unemployment rate in France is 8.4%.
(Source: Macro Trends)
The latest figures and unemployment rate trends show that this European country could never match its neighbors in the number of employed people. The lowest unemployment France has had in recent history was in 1983 when 6.7% of the population was without a job. Today, France’s unemployment rate stands at 8.4%.
11. The unemployment rate in India is 11%.
(Source: Trading Economics)
Moving further east, we learn that India’s jobless rate is much higher than that in the European Union. This should come as no surprise, given that India has a labor force that consists of a massive 466 million individuals.
Prior to the pandemic, India could have boasted with low rates, varying from about 7.2% to 8.7%, spiking up to a whopping 23.5% in April and May of 2020. As of July 2020, the situation calmed down, and India’s highest unemployment rate for the past few years now decreased to 11%.
12. The unemployment rate in China is 4.3%.
(Source: Statista)
China, the second-largest economy in the world, has an unemployment rate of 4.3%. This is an impressive number, considering that the country has a population of nearly 1.4 billion people. The future also looks bright for this Asian country, as reports indicate the rate to drop to 3.8% in 2021.
Unemployment Statistics by State
13. The unemployment rate in California is 13.3%.
(Source: BLS)
The Golden State has the largest population and economy in the US. It is also at the bottom of the list of US states with the highest rates of unemployment. Unemployment used to be an even bigger problem in California in 2010, when it stood at 12.3%.
However, things don’t look too good right now, as according to national unemployment rate data, the rate of unemployment in California is currently 13.3%.
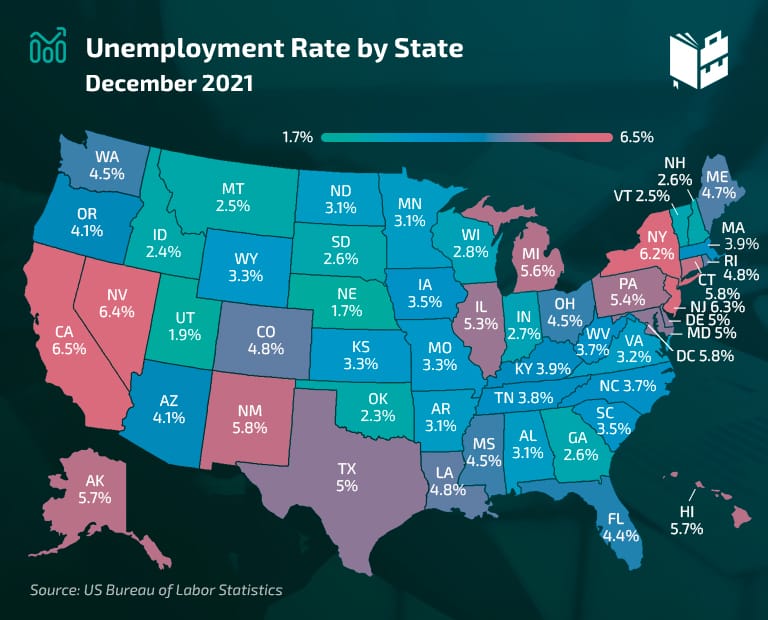
14. The unemployment rate in New York is 15.9%.
(Source: Labor NY)
Unemployment in the Empire State is among the highest according to the July 2020 data. A 15.9% rate means the state of New York records above the national average unemployment rate. New York experienced its highest rate in December 2009, when it was 8.9%.
15. The unemployment rate in Oregon is 10.4%.
(Source: BLS)
The Beaver State’s unemployment percentage is below the national average. However, the relatively low unemployment rate trend has consequences on Oregon’s economy, as its population is much smaller. Oregon experienced peak unemployment in May 2009, when 11.9% of its labor force was unemployed.
16. The unemployment rate in Pennsylvania is 13.7%.
(Source: ABC)
Pennsylvania’s unemployment hit a peak in March 2010, when it stood at 8.8%. Today, it remains at a reasonable 13.7%, amidst the worldwide pandemic, and is identical to California’s USA jobless rate.
Ever since the devastating effects of the 2008 financial crisis, the state of Pennsylvania managed to get back on track, recording a steady yearly decrease in unemployment until April of 2020 when the pandemic outbreak hit US soil.
17. The unemployment rate in New Jersey is 16.6%.
(Source: Planet Princeton)
Unemployment in the Garden State remains above the national average for the past few months, as unemployment numbers today show. Rates of unemployment rose to 16.6% in July 2020, marking a 1.2% increase from June.
18. The unemployment rate in Florida is 11.3%.
(Source: Wink)
Those moving to the Sunshine State without a job lined up can expect no difficulties finding one. The rate of unemployment in the state of Florida is close to the national average, as has been the case countless times in the past.
Florida also had to suffer through the unemployment crisis of 2009/10. In January 2010, the number of unemployed stood at an identical 11.3% as of July 2020.
United States Unemployment Rate 2020
19. The unemployment rate in the US is 3.3%.
(Source: BLS)
According to the unemployment statistics, the unemployment rate in America sits at 3.3%, which is an improvement compared to the beginning of the pandemic, when it was 14.7%.
20. The US has been experiencing a steady decrease in unemployment over the last 12 months.
(Source: Trading Economics)
Long-term US unemployment trends point to an interesting fact — the unemployment rate in 2019 was the lowest in exactly half a century. Sitting at 3.5%, the projected unemployment rate looked to continue throughout 2020, but the coronavirus outbreak had different ideas.
With a 1.8% decrease from July, the rate now stands at 8.4%, with projections estimating a decrease in the coming months.
21. 1.4 million jobs were added to the US economy in August 2020.
(Source: BLS)
The joblessness rate is decreasing, and even though more than 1.4 million jobs became available to Americans during a single month, there are still 13.5 million workers who can’t find part-time or full-time employment.
These improvements reflect a steady resumption in life and economic activity that was hindered by the coronavirus outbreak.
22. There were 23.6 million part-time workers in the US in August 2020.
(Source: BLS)
Part-time workers account for around 17% of the US labor force. The number of people who work part-time involuntarily is 70% of the number of unemployed in the US, which is estimated at 6.2-7.4 million, depending on the unemployment rate definition and calculation method (U-3 or U-6 definition).
23. 41% of recent college graduates are unemployed or underemployed.
(Source: Inside Higher Ed)
Employees who are occupying positions that don’t require a college degree represent a large chunk of the US workforce — as many as 4.5 million. Stats show that as many as 41% of recent college graduates are having it hard when it comes to employment. And if we include experience, the number increases more than fivefold, as the latest unemployment graph stresses.
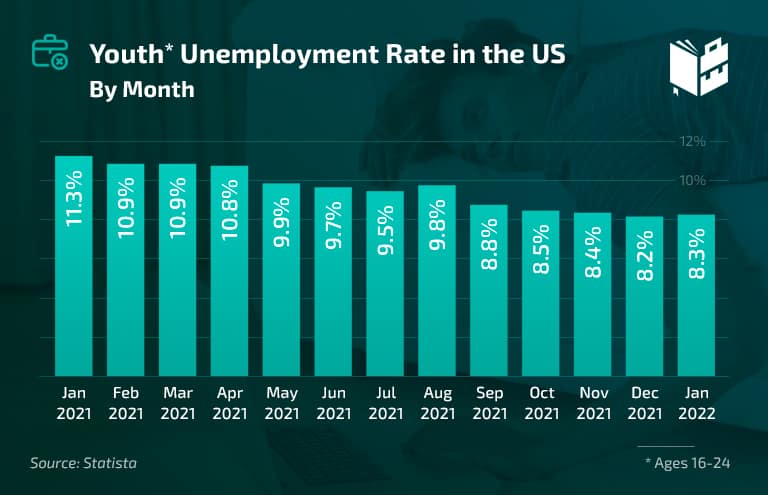
24. 14.7% of US youth are unemployed.
(Source: Statista)
As of August 2020, 14.7% of those aged 16-24 are unemployed. Even though this figure represents a high percentage, it’s positive to note that since April, the rate of unemployment in younger individuals continuously decreases.
Top economies in the world have much lower rates of unemployment for this age group. In Germany, for example, 5.1% of the youth is jobless.
Unemployment Statistics by Race, Sex & Age
25. The unemployment rate for the African-American population is 13.1%.
(Source: Fred)
The job market isn’t the same for everyone. When it comes to unemployment by ethnicity, African-Americans have it the worst. The number of unemployed people in this population is almost double the unemployment rate for Caucasians in almost 15 states.
26. The unemployment rate for the Hispanic population is 10.5%.
(Source: Fred)
Unemployment statistics by year data shows that unemployment for the Hispanic population is equal to the unemployment rate of Caucasians in just three states: Georgia, Oklahoma, and New Jersey. Currently, 10.5% of the Hispanic or Latino population is without a job.
27. The unemployment rate for the American-Asian population is 3.2%.
(Source: Economic Policy Institute)
The unemployment rate for the Asian population is extremely low, according to the data gathered from 11 US states.
28. 14.3% of millennials are unemployed.
(Source: Business Insider)
A survey on the US unemployment rate found that 14.3% of millennials (people born between 1980 and 1996) are currently unemployed, while 12% are not even in the labor force. Contrastingly, 8.1% of Gen X and 8.8% of baby boomers are unemployed, with almost the same percentage not participating in the labor force.
29. The global unemployment rate has reached 6.5% at the end of 2019.
(Source: Statista)
Last year, around 187.7 million people around the world were jobless, according to the most recent stats on unemployment. This means that the global unemployment rate, prior to the pandemic, was the lowest it has been since the financial crisis of 2008.
30. Around two billion workers are in informal employment.
(Source: VOA)
Estimates show two billion workers, or 61% of the global workforce, work “under the table”. This doesn’t only mean that their pay is low and that job security is not a thing for them, but also that they don’t have access to social services and basic workers’ rights.
Unemployment Rates – Summary
Throughout human history, we’ve learned how to predict the weather, earthquakes, and even people’s behavior to some extent.
However, as much as we’d like to think otherwise, long-term economic trends are impossible to pin down. They depend on innovation, global politics, and too many other variables to and too many other variables to have an accurate prediction.
We can, however, be optimistic about the future based on current trends. At the same time, we have to keep in mind that there are numerous aspects we need to work on to justify that optimism.