Especially since the onset of the global pandemic, and even before with the rise of digital nomads, self-employment is a growing sector with many benefits for workers. From greater time management and more autonomy, to a better office environment, self-employment statistics are showing that across the globe, people are beginning to see the benefit of being their own boss.
Self-employment is a fascinating phenomenon, and understanding it further can help you decide if it may be an alternative option for you. While it comes with greater responsibility, the rise of the gig economy is a way that many Americans are supplementing their income to compete with rising costs of living, and minimal wage adjustments.
Here are 23 statistics to show you what self-employment is all about across the globe.
Self-Employment Statistics (Editor’s Choice)
- Approximately 16 million people in the US are self-employed.
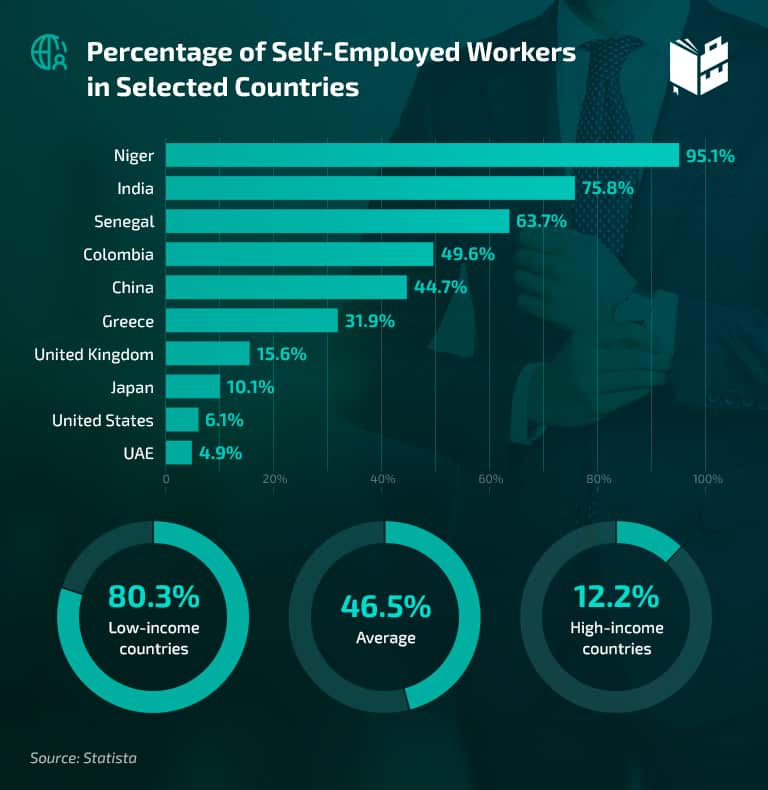
- 81.1% of low-income economy workers are self-employed.
- In the UK, self-employed people account for 13.3% of the overall employment percentage.
- One out of 10 jobs in the US is held by self-employed workers.
- 54% of self-employed people state they work multiple jobs.
- 17.4% of independent self-employed workers without employees wish to work as an employee.
- At the EU level, 84.7% of the employed wouldn’t switch to self-employment.
- Self-employed people in Belgium (27.6%) and Italy (25.8%) face a high administrative burden.
General Self-Employment Stats
1. Approximately 16 million people in the US are self-employed.
(Pew Research Center)
Self-employment is more common than you think. Wages in traditional jobs have been slow to adjust over time, leaving many Americans looking for extra ways to keep up with the rising cost of living. Recent figures show that self-employment is on the rise, as the number of self-employed people actively working increased by 17.6% between 2020 and 2021.
2. 81.1% of low-income economy workers are self-employed.
(ILO)
The number of self-employed people varies from one country to another.
According to self-employment stats, high-income economies have a lower percentage (12.1%) of independent workers, while the countries with a low average income display a higher rate of independent workers (81.1%). This shows an inverse relationship between the affluence of a country and its self-employment rate.
On average, 46.6% of the world’s working population is self-employed.
3. 54% of the self-employed state they work multiple jobs.
(Gallup)
Self-employment statistics show that 54% of independent contractors need to work multiple jobs, compared to 25% of those with an employer. Out of that 54%, only 1% need to perform different jobs because they cannot find full-time employment.
4. At the EU level, 84.7% of the employed wouldn’t switch to self-employment.
(Eurostat)
Based on Eurostat data, 84.7% of employed people stated they wouldn’t leave their jobs and become self-employed. In contrast, 15.7% of self-employed workers would like to work as an employee.
5. 17.4% of independent self-employed workers wish to work as an employee for a company.
(Eurostat)
Self-employed statistics indicate that while self-employment is the current job status for many Americans, it isn’t more desirable for everyone. More than 80% of those who are self-employed prefer it this way, but that still leaves almost one-fifth who wish they were employed by a company.
6. 4.25 million UK residents were self-employed in June 2022.
(Statista)
In June 2022, 4.25 million people reported being self-employed. However, this represents a decrease of over 700,000 people since the beginning of 2020, mainly because of job losses as a result of the coronavirus pandemic.
7. In the UK, the self-employment rate made up 13.3% of the entire workforce in 2021.
(GOV.UK)
The most recent data shows that the percentage of independent contractors in the UK workforce increased from 13.9% in 2011 to 15.3% in 2020. However, that figure dropped to 13.3% in 2021. Additionally, 16.2% of the Pakistani and Bangladeshi accounted for the ethnic group with the highest percentage of self-employed people.
8. Based on the self-employment statistics in the US, one out of 10 workers are self-employed.
(Bloomberg, Federal Reserve Bank of St. Louis)
Self-employed people in the US accounted for 10.2% of the US workforce in June 2022, representing a 0.4% increase from the beginning of 2020. According to the latest data, the highest number of the self-employed are in the construction sector (16.5%), followed by the professional, scientific, and technical services industry (13.5%).
9. Self-employed people in Belgium (27.6%) and Italy (25.8%) face a high administrative burden.
(Eurostat)
Self-employment facts state there are several common difficulties that come with self-employment. From having no customers, having periods of financial hardship to heavy administrative burdens, the most prevalent issue reported in the EU was a heavy administrative burden. This issue was particularly prevalent in Belgium and Italy, although Slovakia, Czechia, and Hungary weren’t far behind.
10. In 2021, Colombia reported that the self-employed accounted for 53.1% of the entire workforce.
(OECD, WorldBank)
For those who are self-employed, work from home statistics indicate that there is an established inverted relationship between the economic class of a country and the amount of people who report they are self-employed. The lower the GDP of a country, the higher levels of self-employment. Columbia has a GDP of approx. 314 billion USD, and as a result, reports about half of its population as independently employed.
11. Niger is the country with the highest self-employed rate (95.1%).
(Statista)
Niger ranks among the poorest countries in the world, and in line with the self-employment inversion pattern, most of its population is self-employed. In low-income countries, economies often fail to support the needs of citizens and their families, leading to many seeking alternative ways to earn an income.
Other explanations point to participation in family businesses which do not document family members as workers and/or working in black market trade, which fails to be properly reported in government statistics.
Self-Employment Demographics
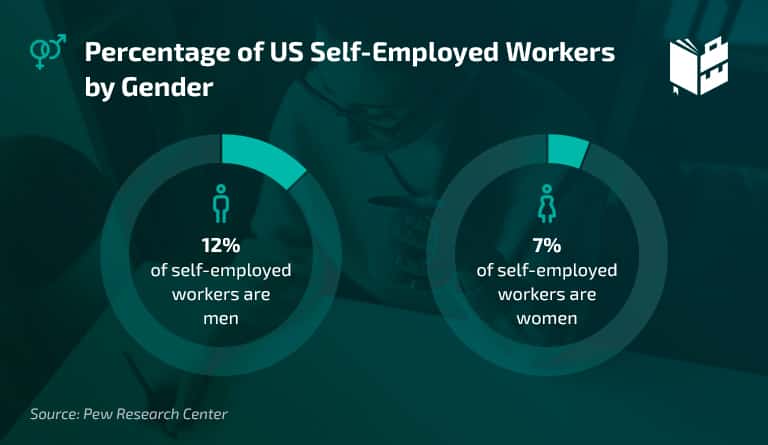
12. The self-employment rates by gender show that in the UK, there are 2.7 million self-employed men and 1.5 million women.
(Statista)
Along with the steady growth of self-employment, the addition of women into this sector has been steadily growing over the years. Notably, while both males and females experienced job loss during the coronavirus pandemic, the self-employed male sector lost more jobs than female workers.
13. In 2019, 40.1% of the self-employed workforce in the US were women.
(BLS)
US workforce demographics show that the gender gap is a pervasive phenomenon. However, the data shows it has narrowed significantly since five decades ago; in 1976, women accounted for only 26.8% of the self-employed population.
In addition, 4.8% of working women were self-employed in the non-agricultural industries in 2019, compared with 6.4% of men.
14. In 2021, self-employed men and women hired 21.2 and 7.1 millions of US workers, respectively.
(Pew Research Center)
The ability to hire employees is a direct indicator of success or security in employment. The gender disparity persists in this part of the sector, with men almost tripling women who take on hires, according to the US workforce size study.
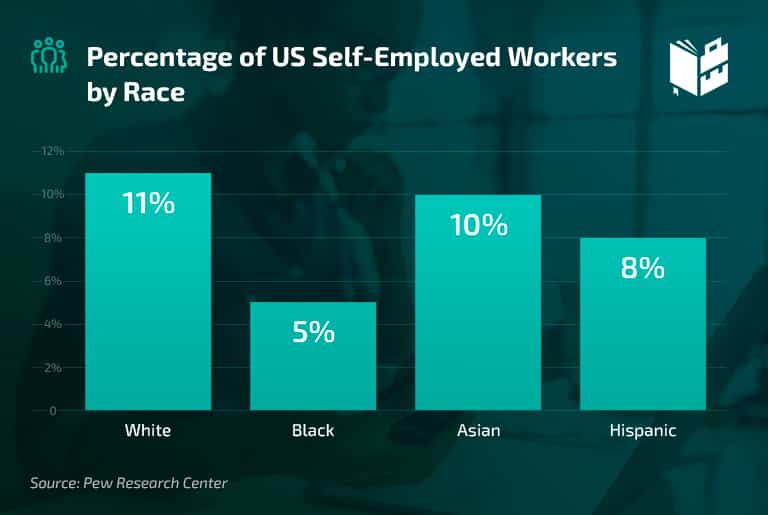
15. 11% of white workers compared to 5% of black workers are likely to be self-employed.
(Pew Research Center)
When research examined self-employment with a racial demographics lens, statistics show a similar disparity between white and black ethnicities. White people were more than twice as likely (11%) to be self-employed compared to black people (5%) in the US.
16. Among Asian employees, 10% are independent contractors, while only 8% of the Hispanic workers belong to this sector.
(Pew Research Center)
Further examination of racial demographics in US job statistics shows that Asian independent workers are almost as common as white independent workers, filling 10% of the self-employment sector. Additionally, one-third of Asian self-employed workers have at least one extra worker, showing them to be major contributors to the workforce.
Hispanic workers, however, ranked somewhere in the middle at about 8%. Interestingly, Hispanic immigrants were twice as likely to work independently (11%), in contrast to Hispanic citizens (6%).
Self-Employment Statistics by Industry
17. In the UK, around 810,000 self-employed people work in construction.
(Statista, Forbes)
Out of 4.25 million self-employed UK residents, 810,000 workers are in the construction industry, the largest number of all industries, and more than twice as much as health and social work activities.
In the US, outside of farming, there are five main industries that account for over half of self-employed workers. Self-employment trends indicate that, apart from construction, professional services, repair and personal services, administrative services, and retail are the other main ways people are independently employed in the US.
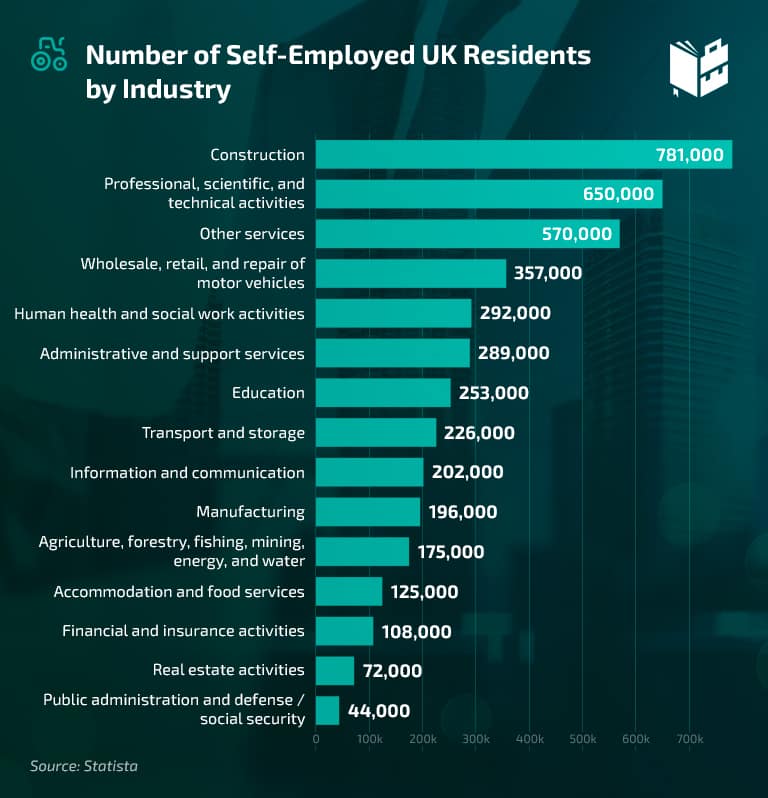
18. The second-largest self-employment industry in the UK is professional, scientific, and technical activities.
(Statista)
Aside from construction, the second largest industry involves work of quite high degree. Services such as accounting, research, architecture, payroll, legal advice, engineering, computer services, and more are all underneath this industry.
Studies on the self-employment rate reveal that this industry amounts to 563 thousand independent workers, while wholesale, retail, and repair of motor vehicles support 279 thousand. Human health and social work reported 340 thousand workers, and administrative and support services held 310 thousand self-employed workers.
19. From 2000 to 2017, independent workers in transportation services grew by 722%.
(Gallup)
Sole proprietors, especially transportation, saw the biggest growth over the last two decades, especially for taxi drivers. With the introduction of alternative transportation services like Uber, it became unnecessary for transportation workers to register with a taxi company, making them now part of the self-employment pool.
Self-Employed Income Statistics
20. 22% of the self-employed have multiple income streams.
(Gallup)
The culture of self-employment greatly varies from those working traditional jobs. In the US, 22%, or 9.7 million self-employed people, work multiple jobs to earn extra money, compared to only 11% (12.2 million) of those who work for an employer.
This gives rise to the popular trend of a gig economy, with more citizens trying to keep up with rising costs by taking on extra income streams.
21. 59.1% of self-employed workers are satisfied with their income.
(Gallup)
There are many factors to consider in employment vs. self-employment salary satisfaction. Recent reports show that 80.8% of people working for an employer are content with their income, while that percentage among the self-employed is significantly lower at 59.1%.
Independent workers, however, enjoy more power to change their working conditions (59.9%), while that percentage among employees is relatively lower (44.3%). After all, job satisfaction is far more than just a good salary; working hours, responsibility, and environment are all factors that contribute to a good employment experience.
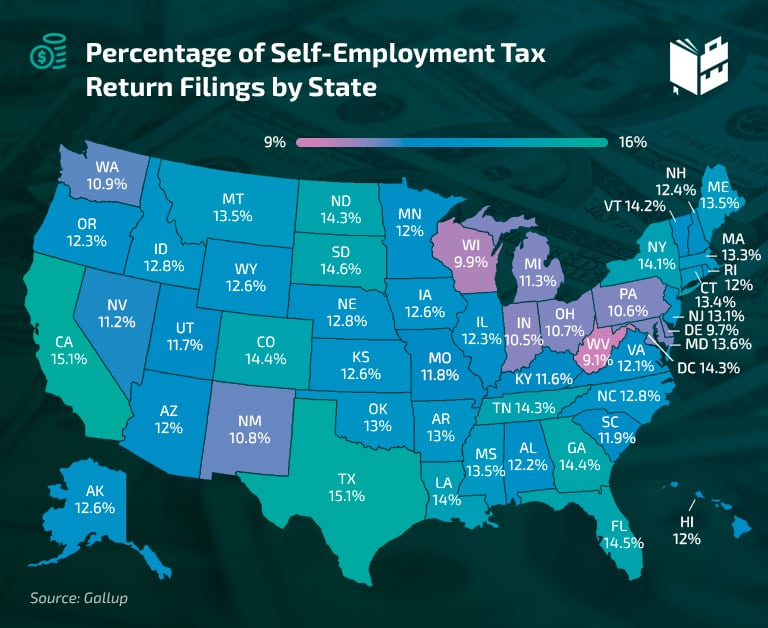
22. The self-employment tax chart shows that California (15.1%), South (14.6%) and North Dakota (14.3%), and Louisiana (14%) have the highest percentage of tax returns.
(Gallup)
While the highest rates of self-employment are found in Florida, Vermont, and Georgia, the highest rates of reported self-employment tax are elsewhere. California reports the highest percentage of self-employment tax returns at 15.1%, followed by North Dakota, South Dakota, and Louisiana.
23. In 2017, only four US states reported a median income higher than $42,000 for self-employed workers.
(Gallup)
The self-employment rates by state revealed that in 2017, the median income of more than $42,000 was found in only four states — the District of Columbia ($53,246), New Jersey ($44,348), Rhode Island ($43,126), and Connecticut ($42,960). Considering the median income for the US is just $31,133 per year, these states show a promising self-employment standard for income. The range for self-employed salaries for all states is between $28,255 and $54,246.
Self-Employed Statistics — Conclusion
Self-employment is a global industry that is steadily growing. While it may trigger images of digital nomads working on computers in beach cafes, it is a vast sector that covers many types of work; farming and construction being among the two biggest industries.
For many, self-employment is a great alternative to traditional employment, providing more freedom to manage their time, money, and responsibilities. Self-employment statistics show that as the world modernizes, cost of living increases, and wages stay the same, many people are choosing self-employment as their source of income.
Additional reading: Freelance statistics you should be aware of.